Summary
The System is designed to help those in the hospitality industry manage their purchasing, stock control and time. Along with calculating a theoretical cost to the business the system can also calculate the potential sales and allow you to compare this against the actual sales per product. The system will then show you this information at the product level highlighting the difference between the two.
The following document outlines how the potential sales figure is calculated and what reports can be used to view this information.
Potential Sales Reporting
- The potential sales can be used to estimate surplus/loss in revenue based on the assigned recipe price. Potential sales does not factor in any ‘allowed’ discount values; such as buy one get one free offers, as the system expects that each menu item will be sold at the assigned price.
- Potential sales calculations on the system will only work if the allocated menu item sales prices are kept up to date on FnB. Discrepancies between the allocated sales price and the price registered on the till will cause variances between actual and potential sales.
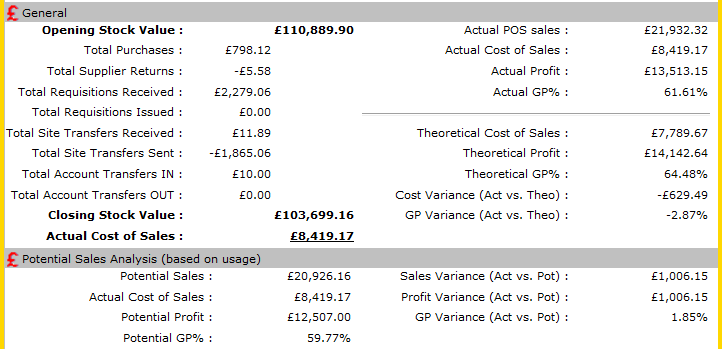
- Once potential sales figures have been activated the total variance in potential sales will be displayed on the management figures. The potential GP figures shown use the actual cost of sales and potential sales to provide profit and GP% figures.

Fig 1 - Management Figures Showing Potential Sales Analysis
- Activating the use of potential sales also alters the last column of the stock reconciliation report to show you difference in potential sales rather than the difference in the weighted average value of the product.
How is the Potential Sales Variance Calculated?
- The potential sales figure is calculated by taking the quantity of the product used and multiplying this by the allocated menu item net sales price.
- If a product is used within multiple recipes, the system uses the recipe which has the highest cost contribution of the product; if two menu items have the same cost contribution, the recipe with the lowest GP percentage is used when calculating the potential sales.
- The potential sales variance can be seen when running the stock reconciliation report. The difference between the actual net sales and the potential net sales is displayed in the last column.

Fig 2 - Stock Reconciliation Report
- To understand where this variance has come from please see the relevant calculation below:
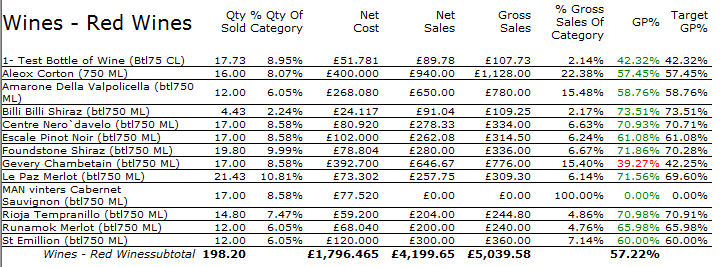
- Actual sales per product can be identified by running the ‘Salesmix report by Product’ report; this shows the quantity and value of the sales per product.
- This is reconciled back to the product from the menu items sold and the % of each ingredient within the menu item.

Fig 3 - Sales Mix Report
- To identify which sales price will be used when calculating the potential sales for a product, for example ‘Le Paz Merlot’ the relevant menu items where this product is used must be identified.
- When searching for the product at site level select the additional PLU tab to view the menu items, relevant measurements and sales prices associated with each menu item.

Fig 4 - Additional PLU Tab
- In this example Le Paz Merlot is used in 2 menu items; the logic applied when calculating potential sales will select the sales price for the menu item with the highest contributing cost, which is the bottle in this example.
- To calculate the potential sales the usage of the product is multiple against the selected menu item assigned sales price:
- Potential Net Sales = Usage (46.1) x (£13.50/1.2) = £518.63

Fig 5 - Stock Reconciliation Report for ‘Le Paz Merlot’.
- This is then compared with the actual net sales to give the difference in potential sales:
Reasons for Variance in Potential Sales
The potential sales is reliant on up to date assigned menu item costs to produce the correct figure, however there are multiple reasons why there could be a variance.
- Incorrect assigned recipe sales price at site will mean that the potential sales calculated is not in line with the businesses current pricing structure.
- Potential sales do not factor in ‘allowed’ discounts from incentives such as marketing offers, BOGOF or complimentary goods for customers.
- Potential sales may be less than the actual is because the system is using the highest cost priced recipe –if that’s a bottle of wine, its more than likely that more money will be made from selling glasses of wine than a bottle
- Potential sales uses the usage figure when generating the potential sales, if there was an operational error with the data entered and the usage figure was incorrect the potential sales figure will also be incorrect.

Comments
Please sign in to leave a comment.