Overview
A clear view of the store's forecast provides the management team the assurance that their inventory ordering and labor schedule is properly aligned with expected sales.
![]() Best practices for Forecasts are as follows:
Best practices for Forecasts are as follows:
-
The forecast should be viewed for the week ahead to review expected sales. Edits and adjustments can be made by store managers
-
Flagging special events and/or promotions in the forecast for any given day or time period will assist with improved future forecast accuracy
Understanding Forecasting
Forecasts
-
Sales
-
Transactions
-
Sales Items
Forecast Types
-
System Generated: These are based on historical data along with configurable inputs from the projection setup made by your administrator, for example, highs and lows removal
-
Manager Forecasts: These are the system generated forecasts plus any edits/adjustments which are made to the forecast by a store manager. This is also known as a restaurant edited forecast
How Forecasting Works
-
Forecasts are generated by averaging actuals from the past 6 or 8 weeks (i.e. last 6-8 Tuesdays). It can consider any adjustments (e.g. removal of highs/lows, seasonality, events, promotions, mirrors, etc.) based on your preferred settings
-
Forecasts are based on 15-minute intervals
-
Historical forecast data is available 2 weeks back
-
Forecasts are generated 2 weeks in advance from the current date to ensure accurate and current data is used
-
Forecasts are viewable by day with drill-down capacity to hourly, and 15-minute intervals. Metrics are forecast at 15-minute intervals and then aggregated as hour and day values
-
Last year’s value depicts actual sales, transactions, and sales item transactions for the equivalent day from the previous year
Viewing your Forecast
- From the Work Flow, select the Review Forecast task (Fig.1), or from the Menu, navigate to the Operations tab, select Forecasting (Fig.2)
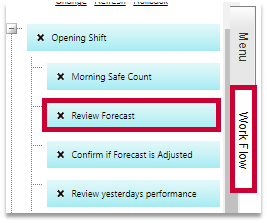
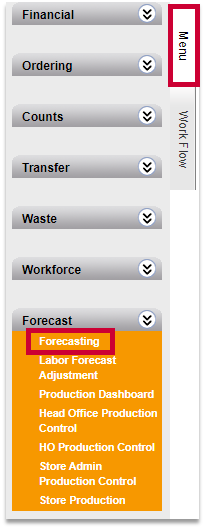
Fig.1 - Work Flow navigation Fig.2 - Menu navigation
- Alternatively, log into the MacromatiX mobile site, select Forecast from the Menu
- Select a forecast type
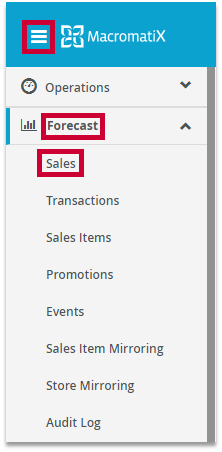
Fig.3 - Mobile navigation
Editing your Forecast
The metrics for the generated forecasts are directly linked to your edits. The following are examples of these edits:
- Edits to sales dollars impact transactions, sales items, and inventory item metrics. See the following example:
- Sales dollars before adjustments for the day are $13,133
- Transactions reflect 1544
- Sales item transactions for chicken sandwiches reflect 503 items
- Sales are then adjusted to $15,000 (+14.22%)
- 1,763 transactions are reflected after the adjustment
- 573 chicken sandwiches sales item transactions are reflected after the adjustment
- Edits to transactions impact sales dollars, sales items, and inventory item metrics. See the following example:
- Transactions before adjustments for the day are 1544
- Sales dollars reflect $13,133
- Sales item transactions for chicken sandwiches reflect 503
- Transactions are adjusted to 2000 (a 29.53% change)
- Sales dollars reflect $17,012 after the adjustment
- 651 chicken sandwiches sales item transactions are reflected after the adjustment
- Edits to sales items impact sales dollars, but would not change transaction counts. See the following example:
- Sales item transactions before adjustments for chicken sandwiches reflect 503
- Sales dollars reflect $13,133
- Transactions reflect 1544
- The sales item chicken sandwiches is adjusted to 600 (a 19.28% change)
- Sales dollars reflect $13,421 after the adjustment
- Transactions remain the same (1544) and are unaffected
- Edits to sales items impact inventory item metrics. See the following example:
- Adjusting a forecast for a chicken sandwich from 10 to 15 increases the chicken breast inventory item by 5
- If 2 pickles are added to each sandwich, the inventory item pickles is increased by 10
![]() Administrators: The sales item must have a dollar value referenced on the sales items page. Item edits impact inventory items by changing values proportionately according to the recipe.
Administrators: The sales item must have a dollar value referenced on the sales items page. Item edits impact inventory items by changing values proportionately according to the recipe.
Making Updates to Sales Including by Service Type
- The Forecast can be shown using different metrics, as well as different day parts and service types
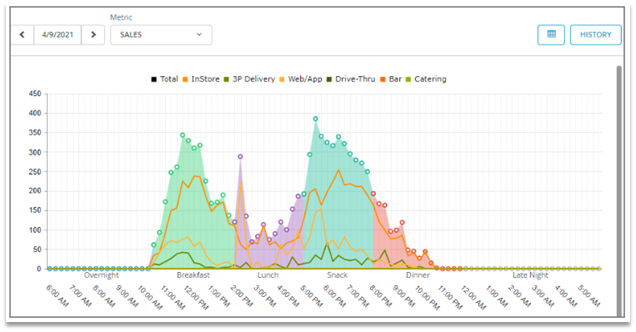
Fig.4 - Sales forecast
- Scroll down and you can make edits under the MANAGER FORECAST column for total sales or by service types. Choose a method of adjustment: dollar value or percentage. Then you can type a value into the editable fields

Fig.5 - Editing sales forecast
- Once any changed values are entered, click out of the editable field and two buttons in the top right-hand corner will appear for you to Save or Cancel
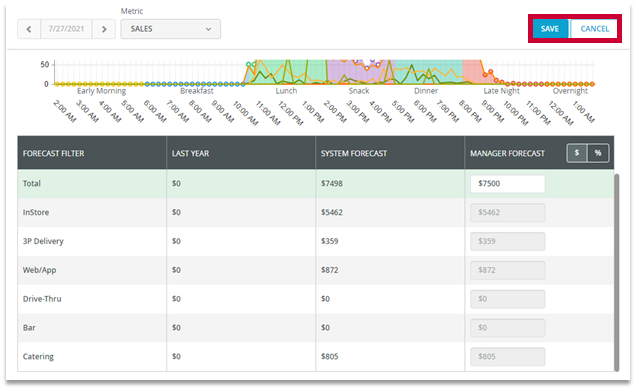
Fig.6 - Save or cancel edit
Making Updates to Sales Intervals
- On the Forecasting page for Sales, select the Grid icon in the top right-hand corner
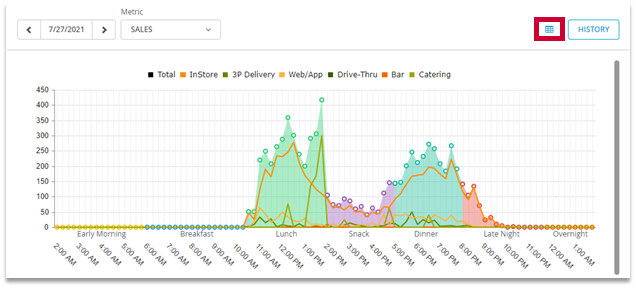
Fig.7 - Grid icon
- You can make MANAGER FORECAST edits to total sales by first choosing a method of adjustment: dollar value or percentage
- Then you can enter in a value in the editable fields next to the interval of trade that you want to impact
- By selecting the Expand icon you can drill-down to enter edits to 15-minute intervals. Select the Collapse icon to drill back up
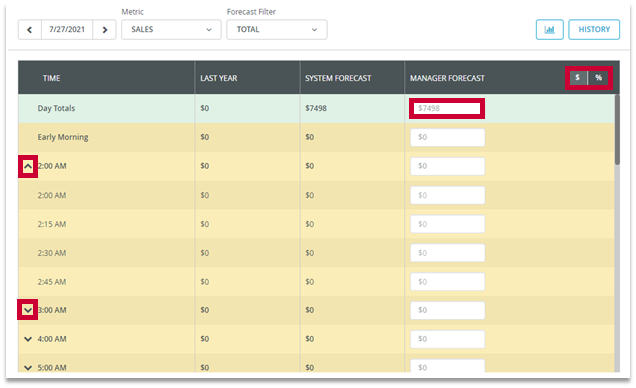
Fig.8 - Editing sales by interval
- An adjustment of $700 (16.67%), at the hour level from $524 for example, is distributed proportionately across the hour based upon original values. (Fig.9) displays the original forecast. (Fig.10) displays a $700 adjustment spread across the hour intervals

Fig.9 - Editing sales by interval example (before)

Fig.10 - Editing sales by interval example (after)
![]() Entering a zero value removes the forecast value as well as all the transactions and sales item values for the time period.
Entering a zero value removes the forecast value as well as all the transactions and sales item values for the time period.

Fig.11 - Entering zero
- After entering the adjustment, select the SAVE button to complete the adjustment or the CANCEL button to abort the adjustment

Fig.12 - SAVE or CANCEL
Forecast History
- On Forecasting, when viewing Sales metrics, select the HISTORY button in the upper right-hand corner
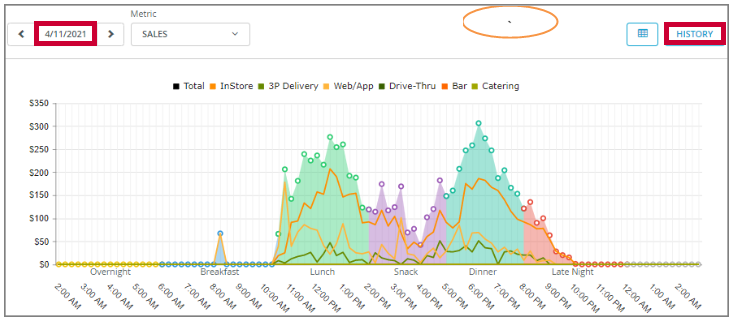
Fig.13 - Forecast History
- On the Sales Chart page, if the forecast date you are looking at is for a Sunday, then values for the six previous Sunday’s are displayed after selecting the HISTORY button

Fig.14 - Historical data
- You can view Historical data for 6-8 weeks prior. Values displayed are for the specified fiscal time period for:
-
Last year's value (if imported by Head Office)
-
Values for all weeks employed in the forecast
-
Forecasted value
-
- When viewing the history:
- Viewing the day, totals are displayed for the given day
- Viewing a day part, totals are displayed for that day part
- Viewing history for the grid, hourly totals are displayed (quarter hour values are not displayed)
![]() Sales history displays sales dollars. Transactions and sales items history displays transaction values.
Sales history displays sales dollars. Transactions and sales items history displays transaction values.
Forecast Evaluator
Managers can access the Forecast Evaluator to compare the forecast’s accuracy as compared to actual sales or transaction values.
Viewing the Forecast Evaluator
- From the Menu tab, select Forecasting
- Then from the Mobile Menu, select Forecast Evaluator
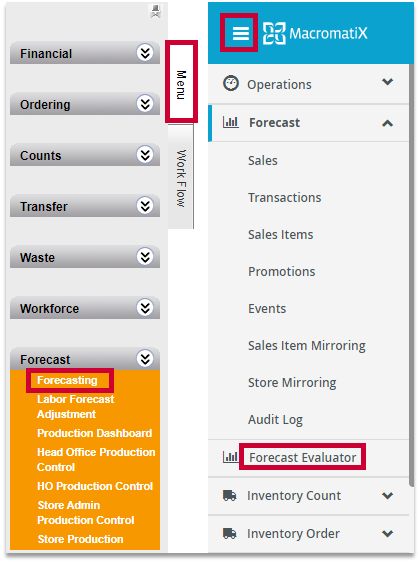
Fig.15 - Menu navigation
- Alternatively log into the MacromatiX mobile site on a mobile device, select Forecast Evaluator from the Menu
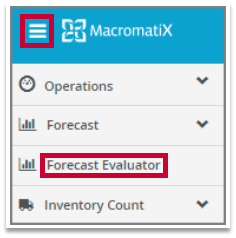
Fig.16 - Mobile navigation
The Forecast Evaluator includes three metric lines that appear on a single graph. One line for Actuals, one for the System Generated values, and another line for any Manager edited values.
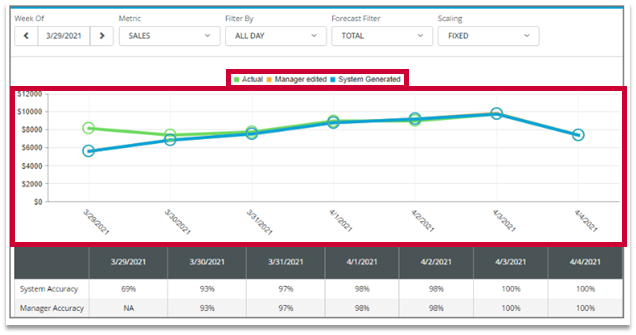
Fig.17 - Forecast evaluator
![]() If no Manager edits were made, no line will display for that category. When a Manager edited forecast is more accurate than the system, the grid value is displayed in green. When a Manager edited forecast is less accurate than the system, the grid value is displayed in red. Data may not display using the color-coded system. Reach out to your corporate contact if this needs to be configured for your store.
If no Manager edits were made, no line will display for that category. When a Manager edited forecast is more accurate than the system, the grid value is displayed in green. When a Manager edited forecast is less accurate than the system, the grid value is displayed in red. Data may not display using the color-coded system. Reach out to your corporate contact if this needs to be configured for your store.
Forecast Events
The Forecasting events feature allows users to:
-
Set up new events in advance of the event date and specify what the expected impact of that event will be
-
Select previous events to be the basis of the forecast for the future occurrence of that event
Forecasting events take into account days that result in a spike above or below what is normal for the season. When forecasting normal conditions, the forecasting engine calculates days using one of two methods:
- A simple average of the last eight of same days of the week. For example, when forecasting Monday, the system would take a simple average of the last eight Mondays
- A seasonal adjustment based on last year's trend. This method takes the simple average method and multiplies it by a year-over-year trend. This trend is determined by comparing the simple average of last year's preceding weeks to the same simple average date range of the current year
![]() Dates flagged as events are not used in standard forecasting so that the standard forecast can be more accurate.
Dates flagged as events are not used in standard forecasting so that the standard forecast can be more accurate.
For example, when the system creates a forecast for next Tuesday (a non-event day), but one of the last Tuesdays was an event, it does not use the last Tuesday as a data point. If a forecast is being generated and requires a date with an event tied to it, then that date is not included in the standard forecast. The forecast looks further into the past to include a date without an event. As a result, the system is configured to use eight historical dates, but if two of the six were events, then the system will still produce eight historical dates (but two are farther back in time – up to 8 weeks).
Basics
-
All events are displayed in the Event Calendar in the Forecasting Event module
-
Clicking on the event displays any associated notes with the profile. Notes can be added
-
There can only be one event per day, even when setting up a partial day event. A store manager may, however, set-up multiple time ranges for a single Event
-
Events can be set up to be multi-day or single day events. If an event is a multi-day event, the user will set up a series of single day Events, for the given time period
-
Store users can create events for holiday periods (i.e. Xmas, NYE) or local level events (football or concerts) for their location
-
Store managers can make decisions around the impact of the event, but the Forecast Evaluator employs the original system forecast and Events are included in the manager's adjustment. This means that manager's accuracy for event days may be more accurate than the system accuracy
-
Store managers are not able to delete an event for a past occurrence. Doing so would allow event days to be used in forecasting as a normal day
-
When copying historical data from an event for a sales item or inventory item that no longer exists, the system will not copy over actuals for that sales item or Inventory item
For example, if in the historical occurrence of the event we sold street lamb tacos, but for the future occurrence of the event we no longer sell street lamb tacos, the history for that sales item: street lamb tacos and inventory item: lamb would not be copied over. Conversely, if there is a new sales item or inventory that does not exist in the history, we do not fill in the forecast values for either.
![]() Days marked as events are not used in generating forecasts for normal days.
Days marked as events are not used in generating forecasts for normal days.
Creating an Event Profile
- From the Menu tab, navigate to the Forecast tab, then select Forecasting
- From the Mobile Menu select Forecast, then select Events
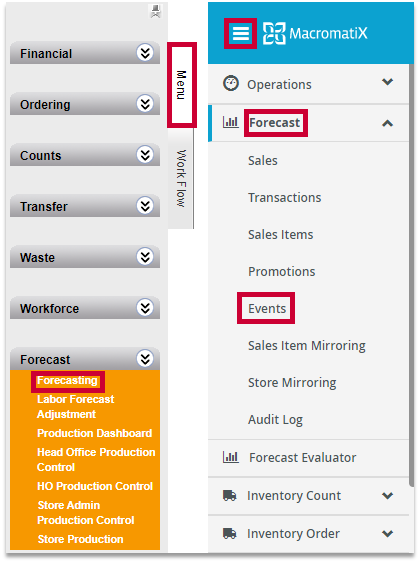
Fig.18- Menu navigation
- Alternatively, log into the MacromatiX mobile site, from the Mobile Menu select Forecast
- Select Events
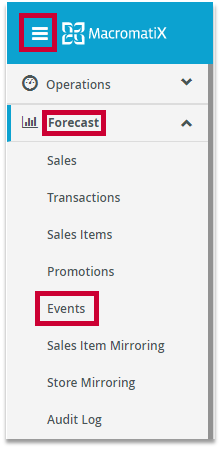
Fig.19- Mobile navigation
- Select the ACTIONS button
- Select Add Event Profile

Fig.20 - Add Event Profile
- Type in a name for the event, then choose from one of the two options:
- Forecast Adjustments from Past Occurrences
- Create Adjustments Manually
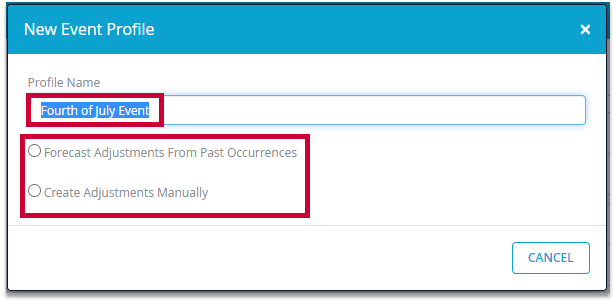
Fig.21 - Profile Name and adjustment selection
Forecast Adjustments from Past Occurrences: Link the Event Profile to specific past dates and figures from those dates.
- Select Forecast Adjustments from Past Occurrences
-
Use the date selector to select the date(s) of sales you want the Event Profile to be based on
-
Select + ADD DATE and enter in any comments about the event as a reminder
-
Select SAVE PROFILE
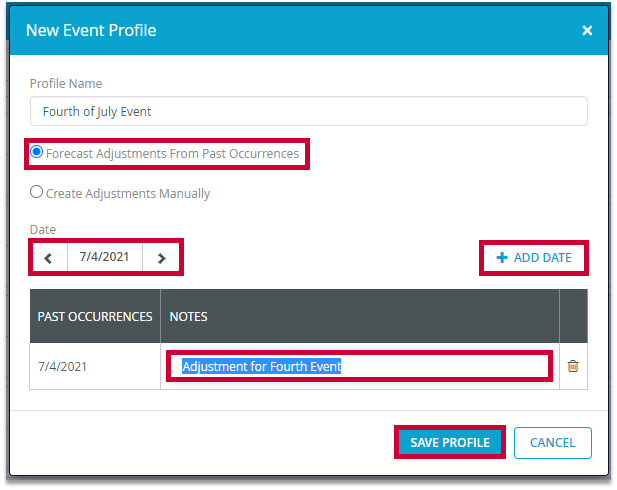
Fig.22 - Forecast Adjustments From Past Occurrences
Create Adjustments Manually: Manually enter in the adjustments, not based on any dates.
- Select Create Adjustments Manually
-
Select ENTER ADJUSTMENTS
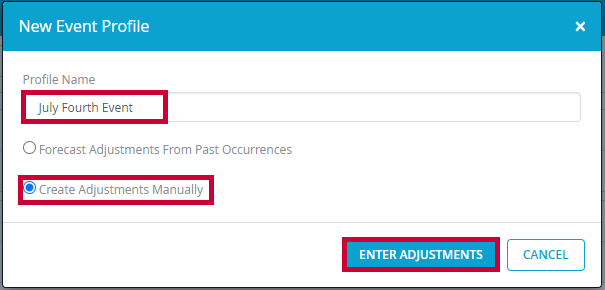
Fig.23 - Create Adjustments Manually
- Enter the percent amount to the entire day or to the specific interval you want impacted
- Select SAVE PROFILE
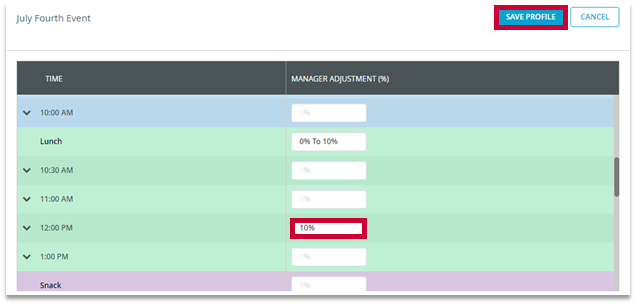
Fig.24 - Interval adjustment
Using an Event Profile Based on Past Occurrences
-
For each 15-min interval of each selected past occurrence date, the system calculates the percentage difference between the actual and the forecasted sales. For example, if the forecasted sales for 8:15 am to 8:30 am was $100 and the actual sales were $120, then record into memory 0.2 (20%) as the increase/decrease for that 15-min interval of that date. The system repeats this exercise for all 96 intervals for each of the past occurrence dates
-
For each 15-min interval, the system takes an average percentage change across all selected past occurrence dates. For example, if for 8:15am to 8:30am the increase/decrease percentages for 3 dates were 0.2, 0.25 and 0.3, then for the profile record, save 0.25 as the adjustment percentage for the 8:15-8:30 interval. The system repeats this exercise for all 96 intervals of the profile record
Schedule an Event
-
From the Mobile Menu select Forecast
-
Select Events

Fig.25 - Mobile navigation
- Click the ACTIONS button, then select Schedule Event

Fig.26 - Schedule Event
- Type in any comments as a way to record why you are applying this event to this date
- Select an Event Profile to apply
- Select SCHEDULE EVENT
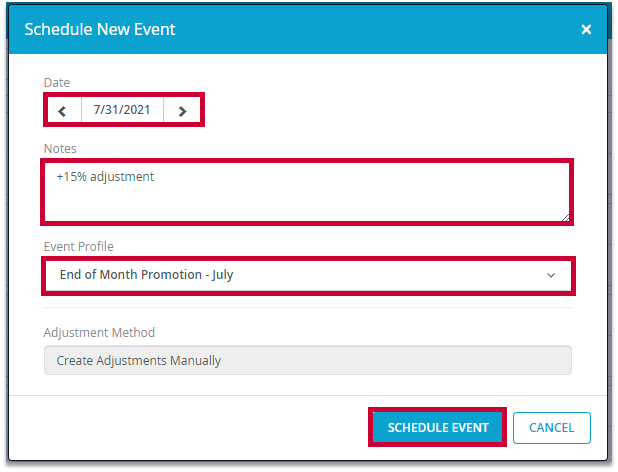
Fig.27 - Schedule New Event configuration
- You will now see the event applied in the Events calendar for the day you selected
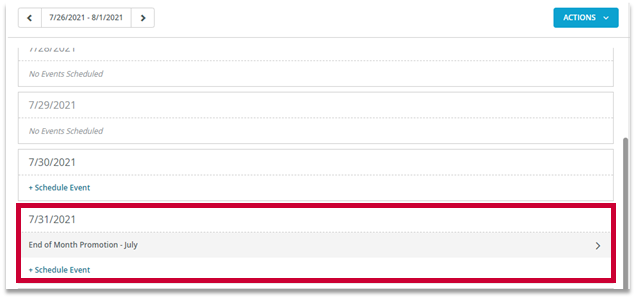
Fig.28 - Schedule Event created
Forecast Promotions
The Promotion Forecasting feature allows in-store promotions to directly impact sales patterns during promotional periods. Promotions may occur on newly introduced items, limited time items, or existing sales items. The Promotions module allows businesses to create an adjustment to the forecast when promotions occur in store. Promotion item adjustments can be set for one or many stores or zones.
![]() Best practices:
Best practices:
-
Anticipate and manage each promotion in the most effective way
-
Plan for the optimal levels of inventory on hand and production, to reduce the risk of waste and shortages
-
Use the forecast data across other tools, such as ordering, production schedules and labor planning
-
More accurate sales forecast improves staffing plans
Basics
- Set the promotional period that the adjustment will impact
- Limited Time Offer capability to flag when promotional items are introduced only for the promotion period
- Determine whether the adjustment will overwrite the Manager Forecast
- Each item included in the promotion to be assigned an adjustment % (No limit on adjustment %)
Creating a Promotion Forecast
- From the Menu, navigate to the Forecast tab, then select Forecasting
- From the Mobile Menu select Forecast, then select Promotions
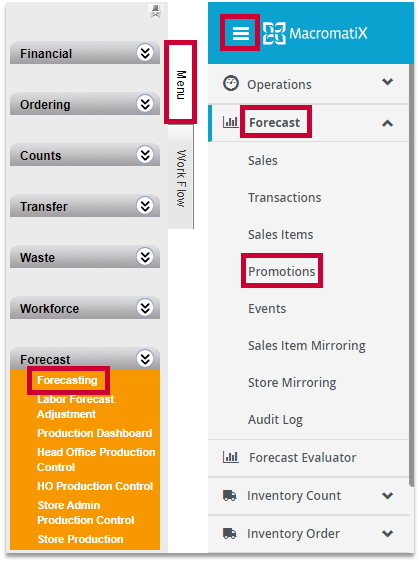
Fig.29 - Menu navigation
- Alternatively, log into the MacromatiX mobile site from a mobile device, then from the Mobile Menu select Forecast
- Select Promotions
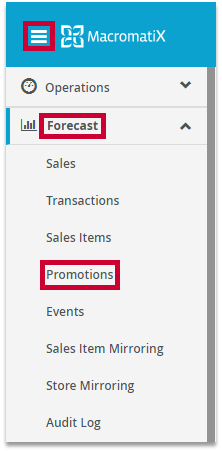
Fig.30 - Mobile navigation
- Select the + ADD PROMOTIONS button

Fig.31 - + ADD PROMOTION
- Enter the name of promotion in the Description field
- Use the date selector in the Period field to select the date range of promotion
-
Select or deselect the Limited Time Offer check-box.
![]() If Limited Time Offer is selected and the current forecast day for this promotion has ended, the items in the promotion are no longer on sale. Otherwise, it will reverse out the effect of this promotion on the historical transaction count and recalculate the system transaction count of the promo item based on historical transaction count after reversed out.
If Limited Time Offer is selected and the current forecast day for this promotion has ended, the items in the promotion are no longer on sale. Otherwise, it will reverse out the effect of this promotion on the historical transaction count and recalculate the system transaction count of the promo item based on historical transaction count after reversed out.
- Select or deselect the Overwrite Manager Forecast check-box. It will determine whether the adjustment will overwrite any Manager Forecast entries
- Select the +ADD button to add PROMOTION ITEMS and the other +ADD button for IMPACTED ITEMS
- Enter the adjustment percentage in the ADJUSTMENT field for the promotion items and impacted items
- Select the ZONES/STORES button to switch to select stores, then select the stores involved in the promotion
- Select the SAVE button to create and save the promotion
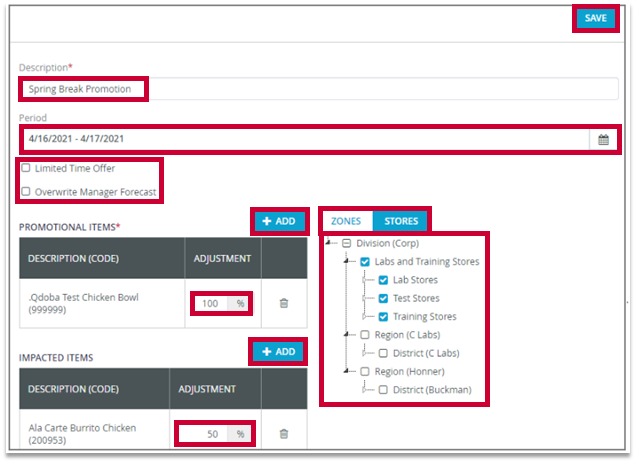
Fig.32 - Promotion configuration

Comments
Please sign in to leave a comment.