Overview
Fourth Analytics allows users to export dashboards, reports, and graphs so the data can be further analysed and shared within the business. This article will explain the HR dashboard.
The HR Dashboard contains the following tabs:
- Overview
- Demographics
- Starters
- Leavers
- Leavers LOS
- Headcount
- Retention
- Length of Service
- Turnover
- Absences
- Bradford Factor
- FTE & WTD
There are two versions of the HR dashboard available as standard:
- Data reported by calendar month (Gregorian calendar – January - December)
- Data reported by financial period (Financial calendar – Based on the calendar set up in the project). More information can be found here: Fourth Analytics: Understanding the Financial Calendar.
Demographics
The Demographics tab provides a snapshot of current employees, including the number of employees per division, employment type, and contract type.
Nationality data is held within the core solution (Workforce Management), if unknown nationality is present, this must be updated in the employee's record within the core solution.
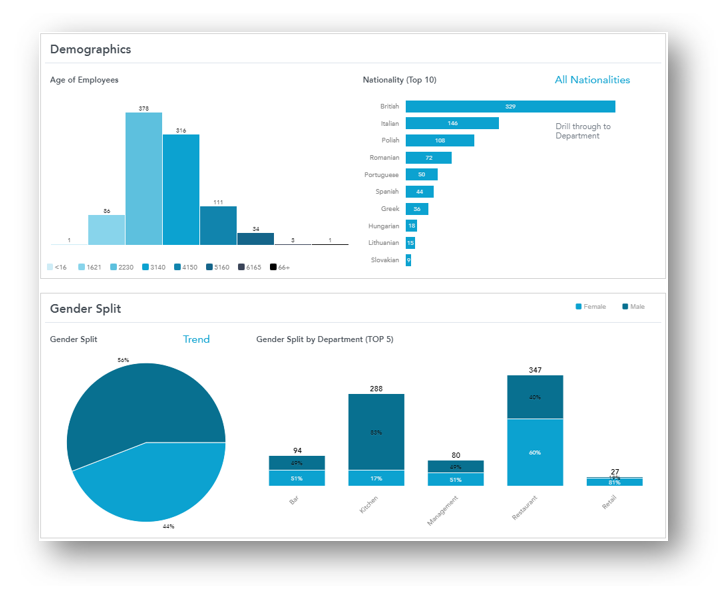
Fig.1 - Demographics tab
Absences
Users can use this tab to identify common reasons for absence, absence frequency, and compare this by location and date. Data is recorded by absence spell.
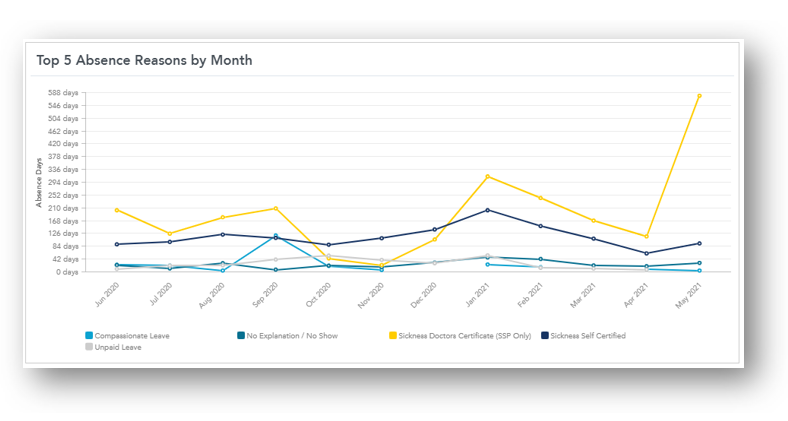
Fig.2 - Absence tab
MAT Headcount & Turnover
Fourth Analytics uses Moving Annual Turnover (MAT) headcount when calculating staff turnover %. ‘Moving Annual’ can also be referred to as ‘12 month rolling’ and is considered a more consistent way of measuring the impact of activities, like people leaving the business, as the number of leavers typically move with seasonality to a certain degree.
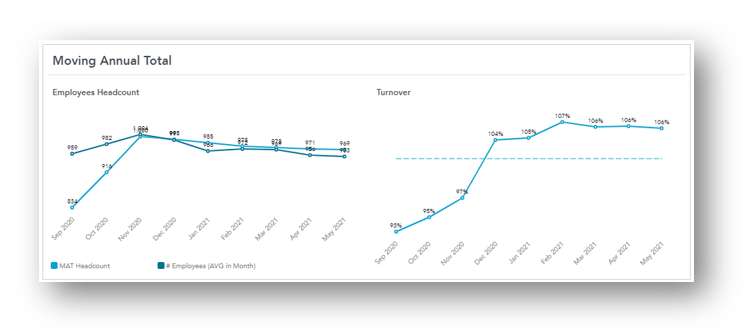
Fig.3 - MAT headcount and Turnover
- Analytics calculates headcount by taking the average number of employees per day over the month or financial period
- In contrast, the Workforce Management solution (WFM) calculates headcount by adding together the total number of employees at the beginning and at the end of the calendar month and then divides this value by two to give the average headcount
As a result, Analytics and WFM Staff Turnover % will differ slightly.
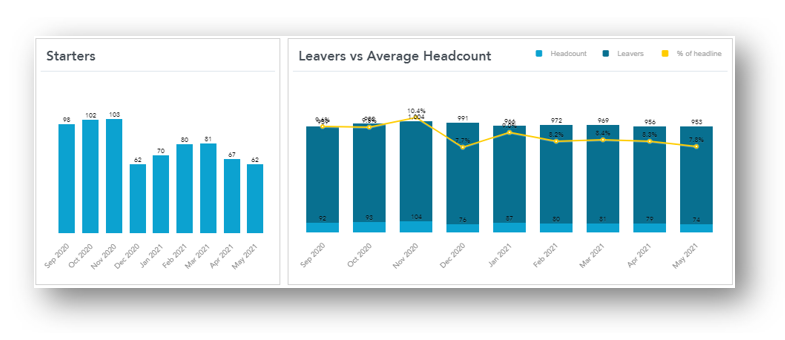
Fig.4 - Starters and Leavers vs Headcount
Staff turnover % = Total Leavers for last 12 months/financial periods divided by MAT Headcount.
Please note: Total leavers are calculated the same in Analytics and WFM when reporting by calendar month, however, in Analytics customers can also report Staff Turnover by financial calendar i.e. last 12 or 13 periods.
Termination Reasons – Exclude from Turnover
In WFM, any reasons for leaving marked with Exclude from Turnover will be filtered out of leavers metrics by default within Analytics.
For more information please navigate here:
- WFM UK HR: Creating Termination Reasons
- Or if you have the new user interface: New UI WFM UK HR: Creating Termination Reasons
Users can use the dashboard filter, Reason for Termination to exclude certain reasons from being included in the leavers and staff turnover metrics, e.g. reason XX – Other
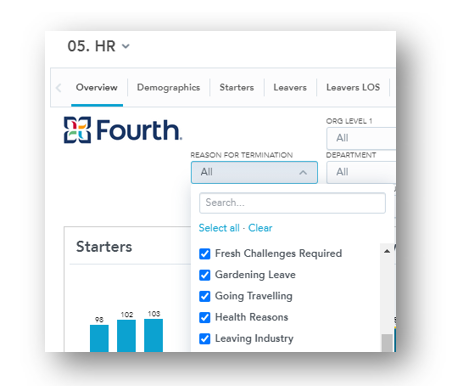
Fig.5 - Termination Reasons
Bradford Factor
The Bradford Factor section contains the Bradford Factor report listing all employees and their Bradford Factor score, including their number of absence days and absence spells. By default, this report is sorted by the highest Bradford Factor.
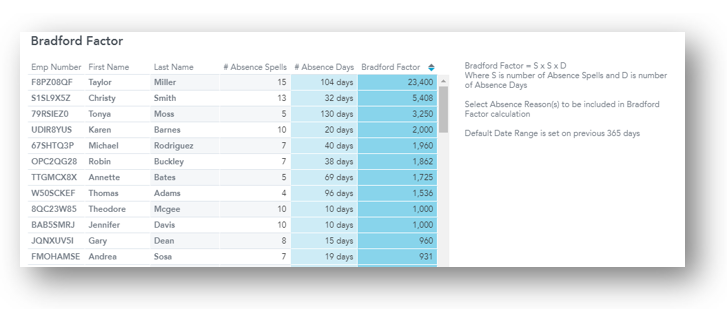
Fig.6 - Bradford Factor
Bradford Factor can be used as a means of measuring worker absenteeism. The theory is that short, frequent, and unplanned absences are more disruptive than longer absences.
Absence reasons can be filtered in Analytics, whereas in WFM, all absence reasons are included in the Bradford Factor calculation.
For more information on the Bradford Factor configurations, please see WFM UK HR: Bradford Factor.
FTE & WTD reports
To calculate the Full-Time Equivalent (FTE) amount, Analytics divides all hours worked (for hourly employees) by 40 and adds the number of salaried paid employees.
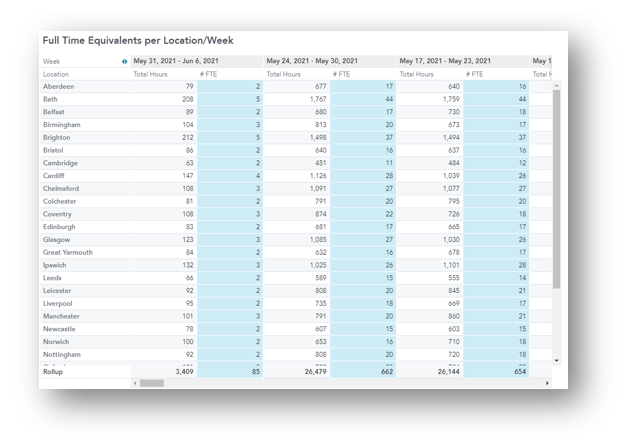
Fig.7 - FTE calculations
Working Time Directive (WTD) reports displaying any Employees who worked more than 48 hours. The metric is based on the average amount of hours worked over the last 17 weeks and includes employee details such as employee number, First and Last Name, and the Average amount of hours work.
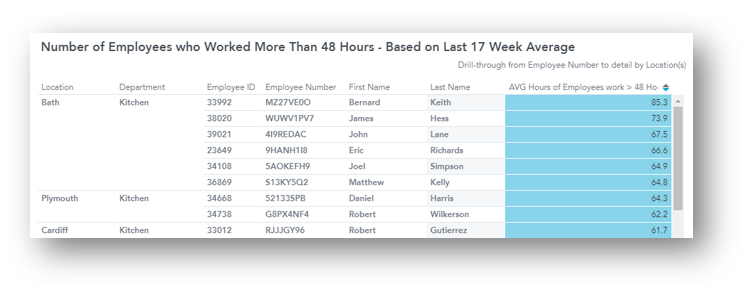
Fig.8 - WTD report

Comments
Please sign in to leave a comment.