Overview
This document will provide an introduction to the Fourth Analytics system. Covered in this article is, navigating through core functionality, filtering dashboards and exporting data.
Access is available via Single Sign-On or a valid username and password, for further support on regaining access navigate here.
Data and Reports
- Log in to Fourth Analytics
- Switch between different dashboards using the drop-down menu in the top left

Fig.1 – Selecting dashboards
- Toggle between dashboard tabs to view reports, which summarise business data

Fig.2 – Dashboard tabs and reports
- Use dashboard filters to specify dashboard data time periods or attribute values

Fig.3 – Filtering by specific Area Manager in the Labour (Overview) dashboard tab

Fig.4 – Filtering by Financial Week in the Labour Cost dashboard tab
- When making any selection from a drop-down filter, there is the option to 'Select all', as well as making a single selection 'Only', when hovering the cursor over a selection

Fig.5 - The Select all and only buttons when using drop-down filters
- Hovering over chart values will display summarised data

Fig.6 – Summarised data when hovering over chart value
- Selecting linked report values will allow for deeper analysis. Data can be displayed in different formats such as tables, line charts, bar charts, and pie charts
- Data is refreshed daily from core Fourth Systems - Workforce Management, Inventory, etc

Fig.7 – Pop up box data using a linked report value
- To return to the dashboard, close the dialogue box
- Share findings by exporting a report to a variety of formats from its drop-down info panel, or export an entire dashboard to PDF using the print icon. For more information please see Fourth Analytics: Exporting Data

Fig.8 – Different options when exporting from a report
- Filters allow for specifying which data goes into one or more reports on a dashboard. Filters are initially configured by a dashboard editor but can be used by anyone viewing a dashboard
- Dashboard filters are 'sticky' - when a filter is applied to one dashboard it will automatically be applied to all others

Fig.9 – Example of available filters on a dashboard
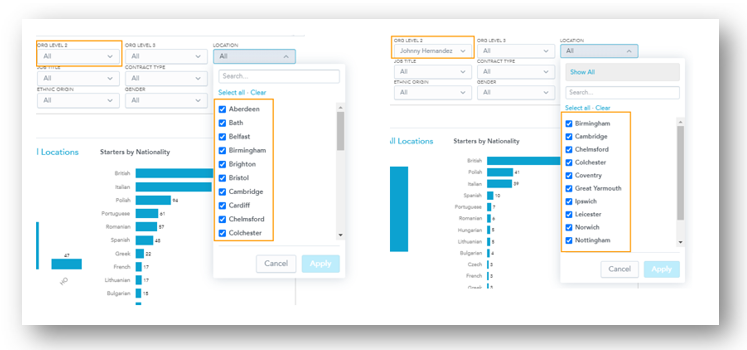
- Fourth Analytics uses parent filters. For example, when a dashboard is filtered to ‘Org.2’ only the relevant Locations are displayed

Fig.10 – Filtering by Ops Manager and the knock-on effect to visible Locations

Comments
Please sign in to leave a comment.