Overview
There is now a new and improved Analytics platform. As your business has no doubt undergone some change in the last 12 months, so has Fourth Analytics.
This article will detail a few of the new interfaces and additional features included from HR & Payroll, to Operations & Stock Management. Fourth Analytics’ purpose-built dashboards give you all the insights you need to make truly data-led decisions.
Some of the features included are Single Sign-On, an Admin app (Fourth Analytics: Analytics Admin) and Online Learning. If you are interested in migrating to the new platform please register your interest here and find out more.
Exploring Dashboards
Trend Analysis
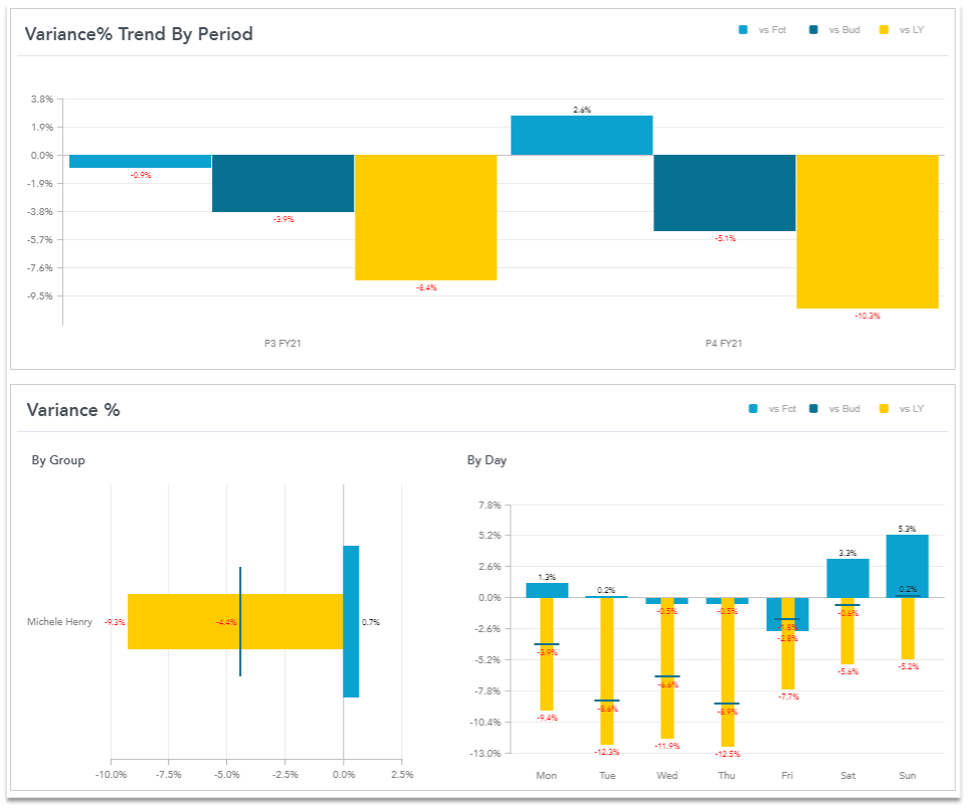
Track performance and understand your business’ trajectory with trend-led reporting. Define and measure success across your whole business or by location and category, over whatever timeframe you choose.

Fig.1 - Trend report in the Sales dashboard
Schedule Detailed Reports Straight to your Inbox
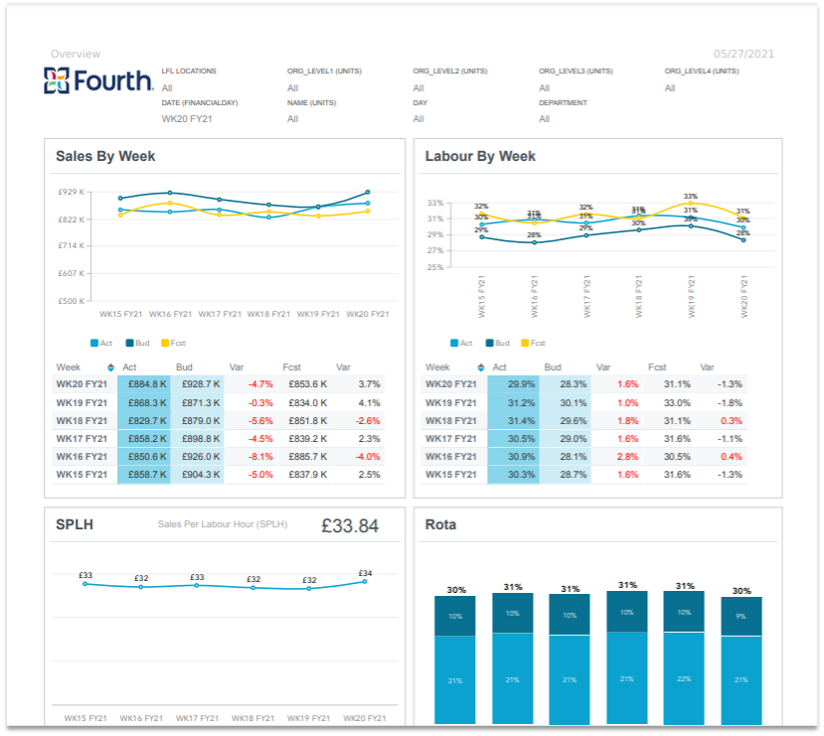
By scheduling regular reports, receive high-level overviews of key data points so you always stay in the know, without even needing to log in.

Fig.2 - Overview tab in the Labour Dashboard
Menu Engineering – Profitability or Popularity?
Through full analysis of your menu, evaluate which items are profitable, popular, and most importantly, which ones require further attention. Our menu engineering matrix encourages you to constantly revise your menu based on what customers want and will drive profit as well as managing costs and reducing waste.

Fig.3 - Menu Item Classification report in the Inventory dashboard
Understand Forecast Accuracy and Scheduling In One Place
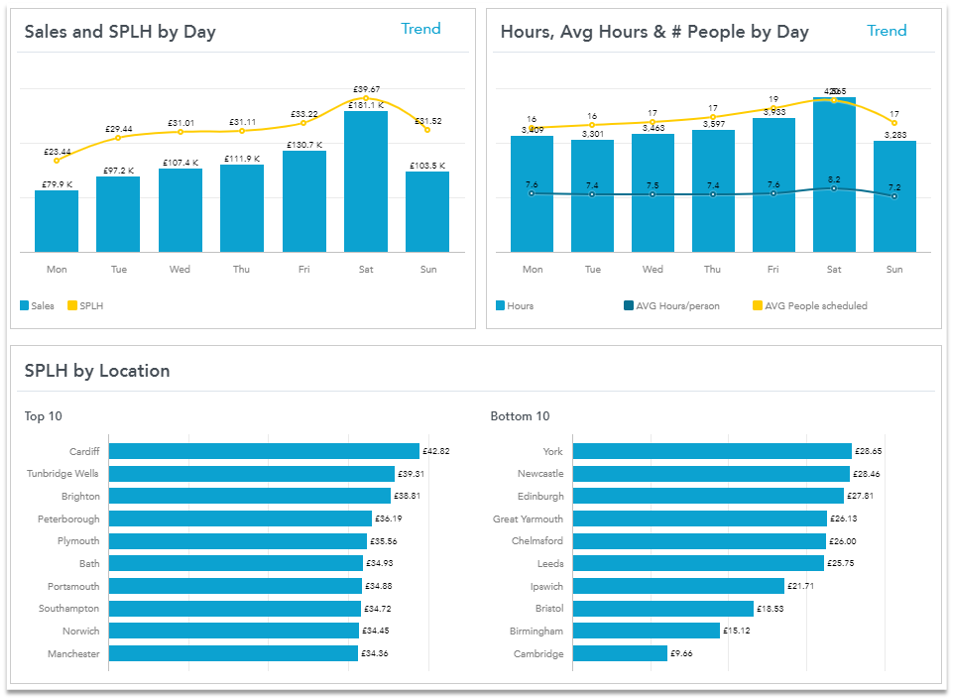
Labour reports allow you to analyse Sales and Items per labour hour (SPLH/IPLH) and track average daily sales, hours and number of people scheduled. With this data, review operations efficiencies to give a complete snapshot of the business.

Fig.4 - Rota Analysis in the Labour dashboard

Comments
Please sign in to leave a comment.