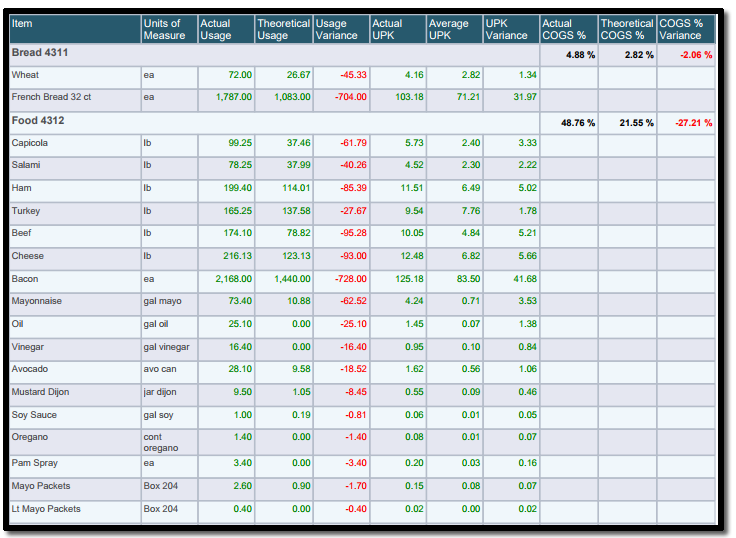
The UPK & Expected Usage Report compares actual quantity versus the theoretical usage. The actual quality is derived by the inventory count numbers, whereas the theoretical usages is based on sales recipes as provided by Jimmy John's Corporate.
Note:
Actual UPK - Item Usage per $1000 sales.
Average UPK - Average UPK over the last 6 weeks.
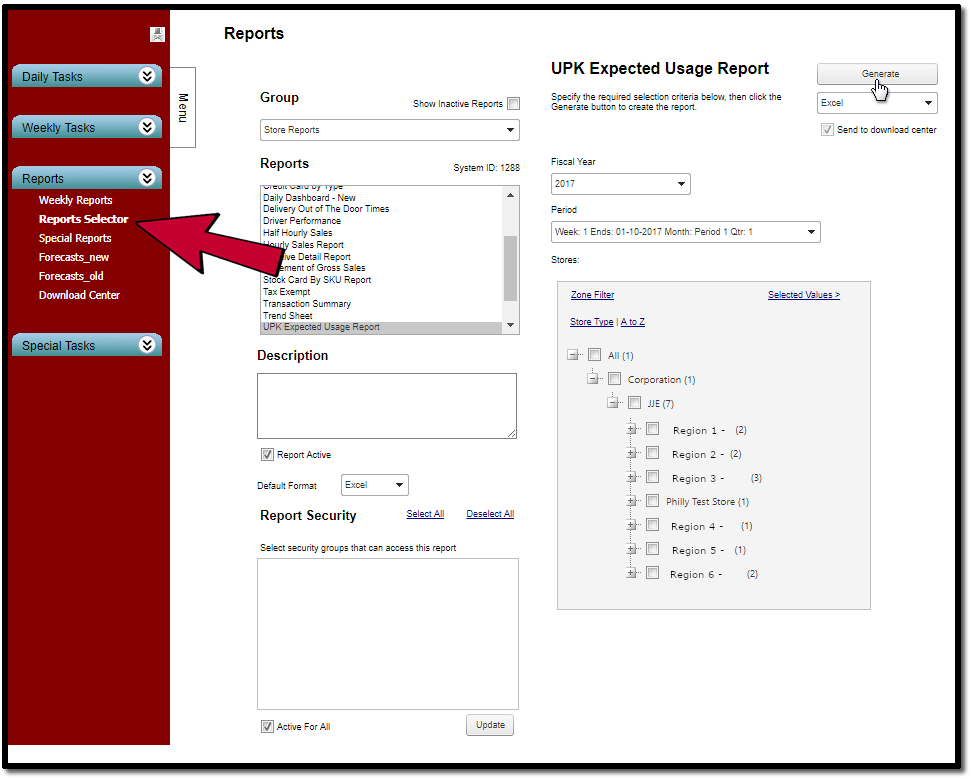
Follow these steps to generate the UPK & Expected Usage report in Macromatix:
- Under the Reports tab, select the Reports sublink.
- Choose the UPK Expected Usage Report in the Reports menu.
- Specify the required Period and Store - check box next to area or store.
- Note: Default date range will be "All Days"
- Choose report format (PDF, Excel, CSV, etc).
- Select Generate.
*The report will be sent to the Download Center


Comments
Please sign in to leave a comment.