Overview
Fourth Analytics allows users to export dashboards, reports, and graphs so that the data can be further analysed and shared within the business. This article will explain how to manually export data in multiple ways. It is also possible to configure scheduled exports of reports and dashboards, see Fourth Analytics - Scheduled Dashboards and Reports for guidance on this.
Exporting Dashboards
- When viewing a dashboard, select the cog icon in the top-right corner
- Chose either Export to PDF or Export to XLSX (Microsoft Excel format)
PDF and XLSX files will be saved to the user's default download folder.
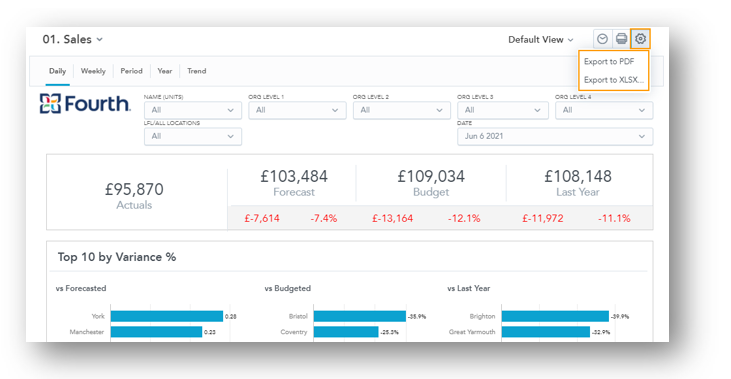 Fig.1 - Choosing to export either to PDF or XLSX
Exporting to PDF will generate a single PDF file that contains all data, graphs, and tables as shown on the dashboard webpage.
Exporting to XLSX inserts the whole dashboard into multiple tabs within an Excel spreadsheet. Geo charts and key metric widgets cannot be exported to XLSX and will not be included in the export file.
When selecting Export to XLSX, a pop-up will appear with two options:
- Keep attribute cells merged or Include active filters in each report
- Select Export when ready
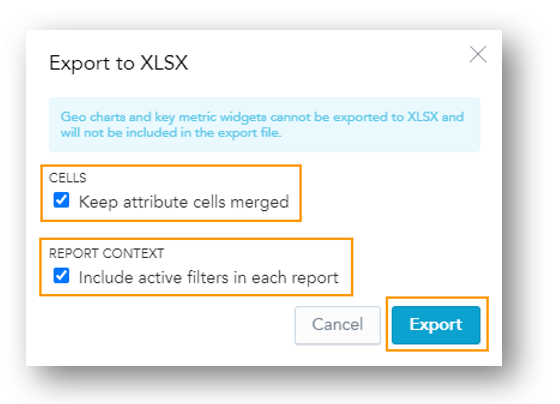
Fig.2 - Export to XLSX options

Fig,3 - Example XLSX format export
Exporting Graphs
It is also possible to export individual graphs from dashboards.
- Hover the cursor over a graph until the ellipsis icon '...' appears
- Use the dropdown Download As...
- Choose a file type from the list
- Image (PNG)
- XLSX
- CSV (formatted)
- CSV (raw data)
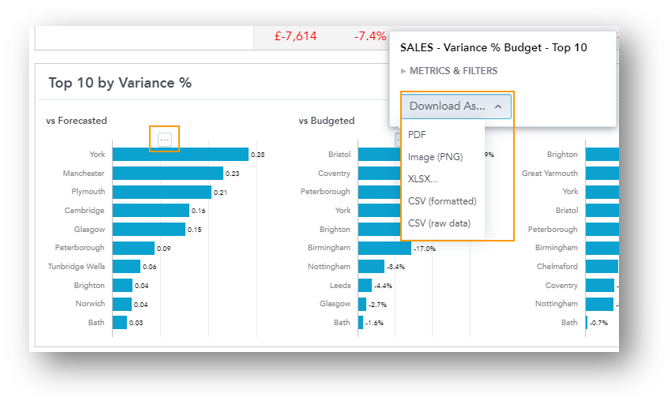
Fig.4 - Exporting a graph
XLSX and CSV formats will present numerical data, as with exporting whole dashboards. PDF and PNG formats will provide a graphical representation of the graph selected.
Exporting Reports
Reports can be downloaded in the same way as dashboards and graphs.
- Select the ellipsis button '...' in the middle of the report and use the Download As... drop-down as required
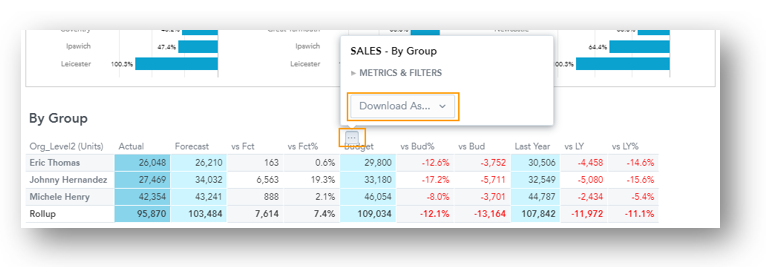 Fig.5 - Exporting a report
- Hover the mouse cursor over report fields - if any are underlined, they can be selected and 'drilled down
The example shown below in Figs 6 & 7 shows a location-level breakdown for the Org_Level "Eric Thomas".
 Fig.6 - Selecting an underlined report field

Fig.7 - Drilled-down location level breakdown
The drilled-down data will display in table format by default.
- To view the data in a different format, use the buttons in the top-right corner - as shown in Fig.7.
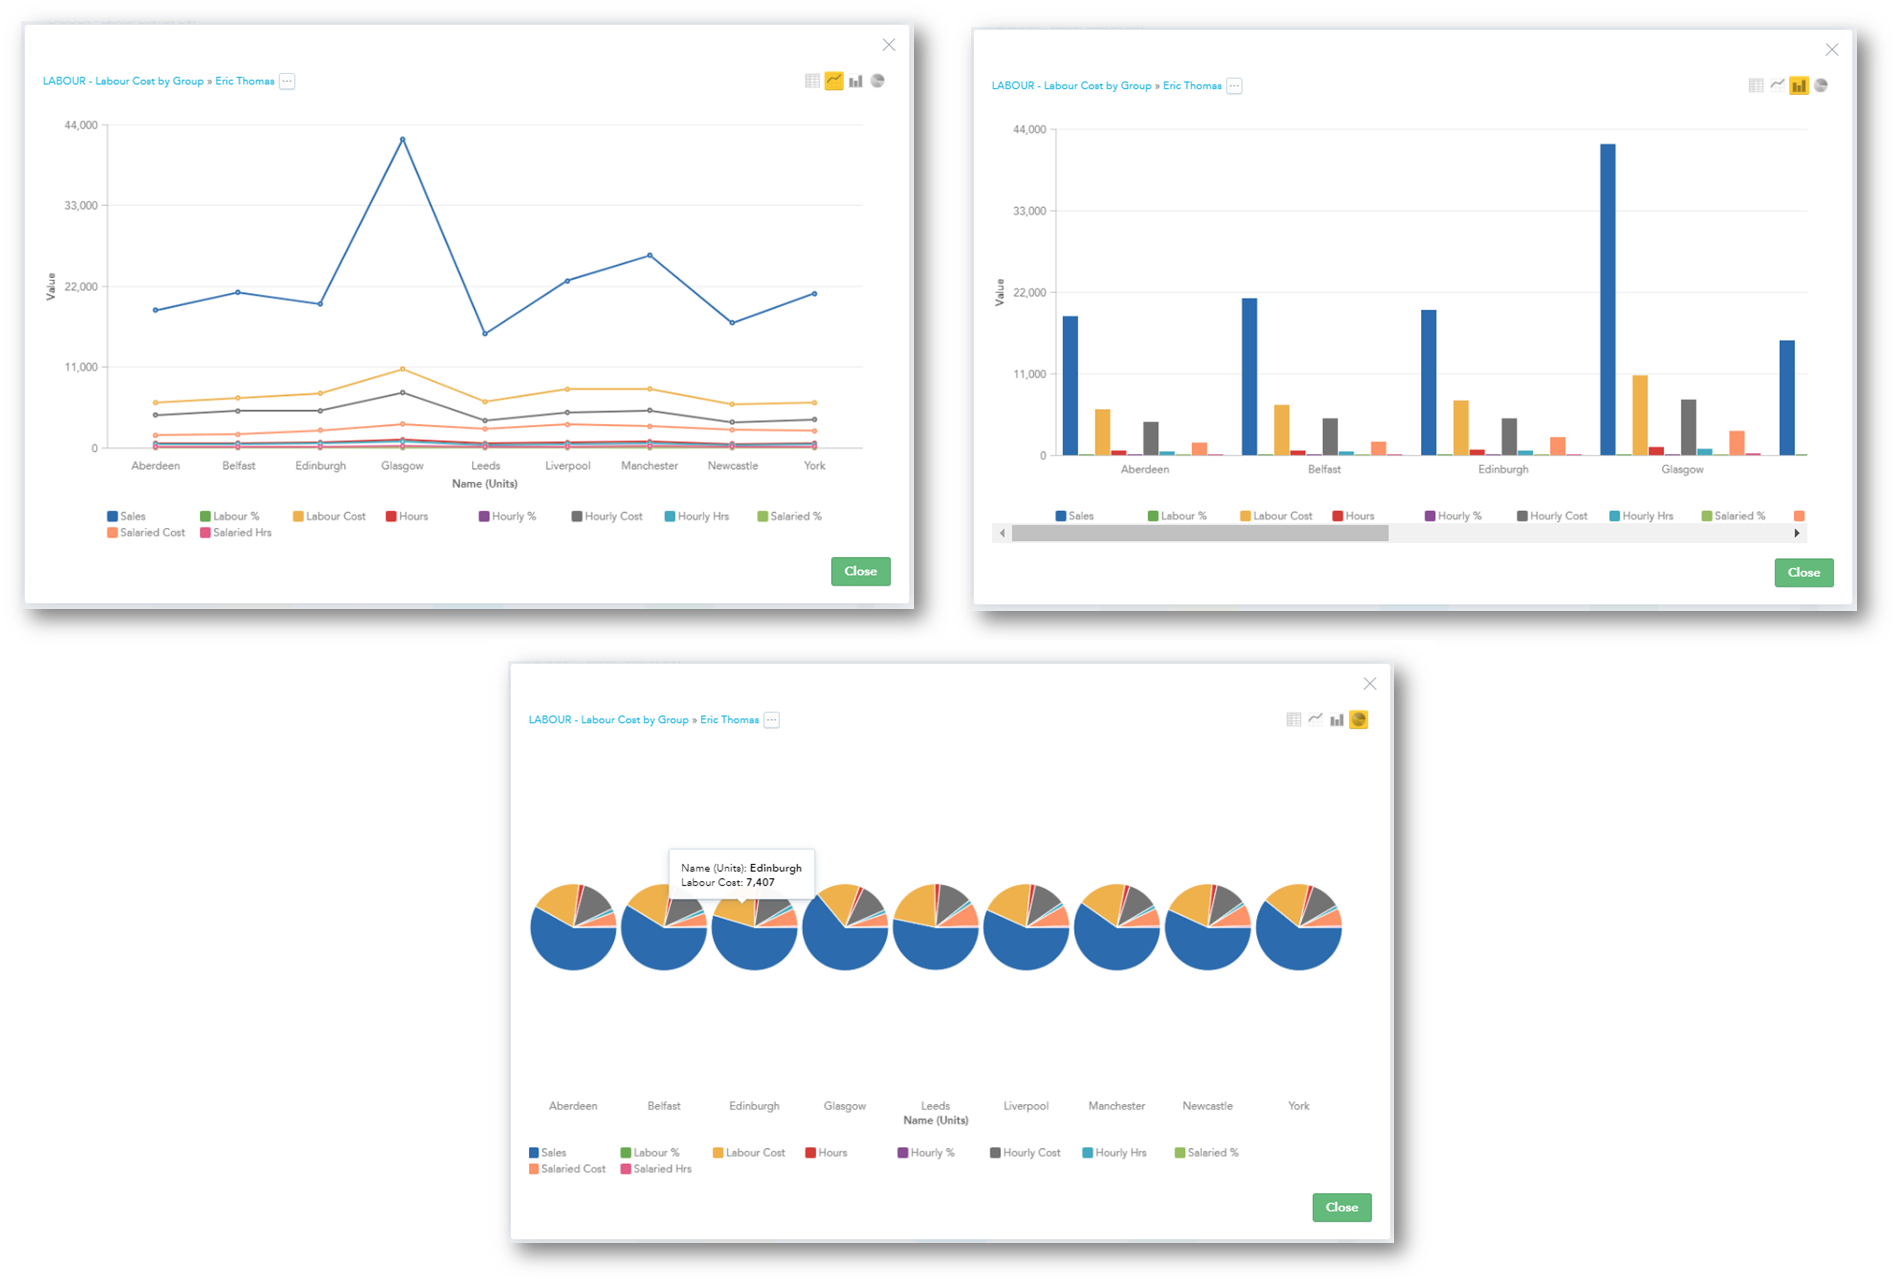
Fig.8 - Line, bar, and pie chart views
- Once the preferred view is applied, select the ellipsis icon '...' and use the Download As... drop-down as normal
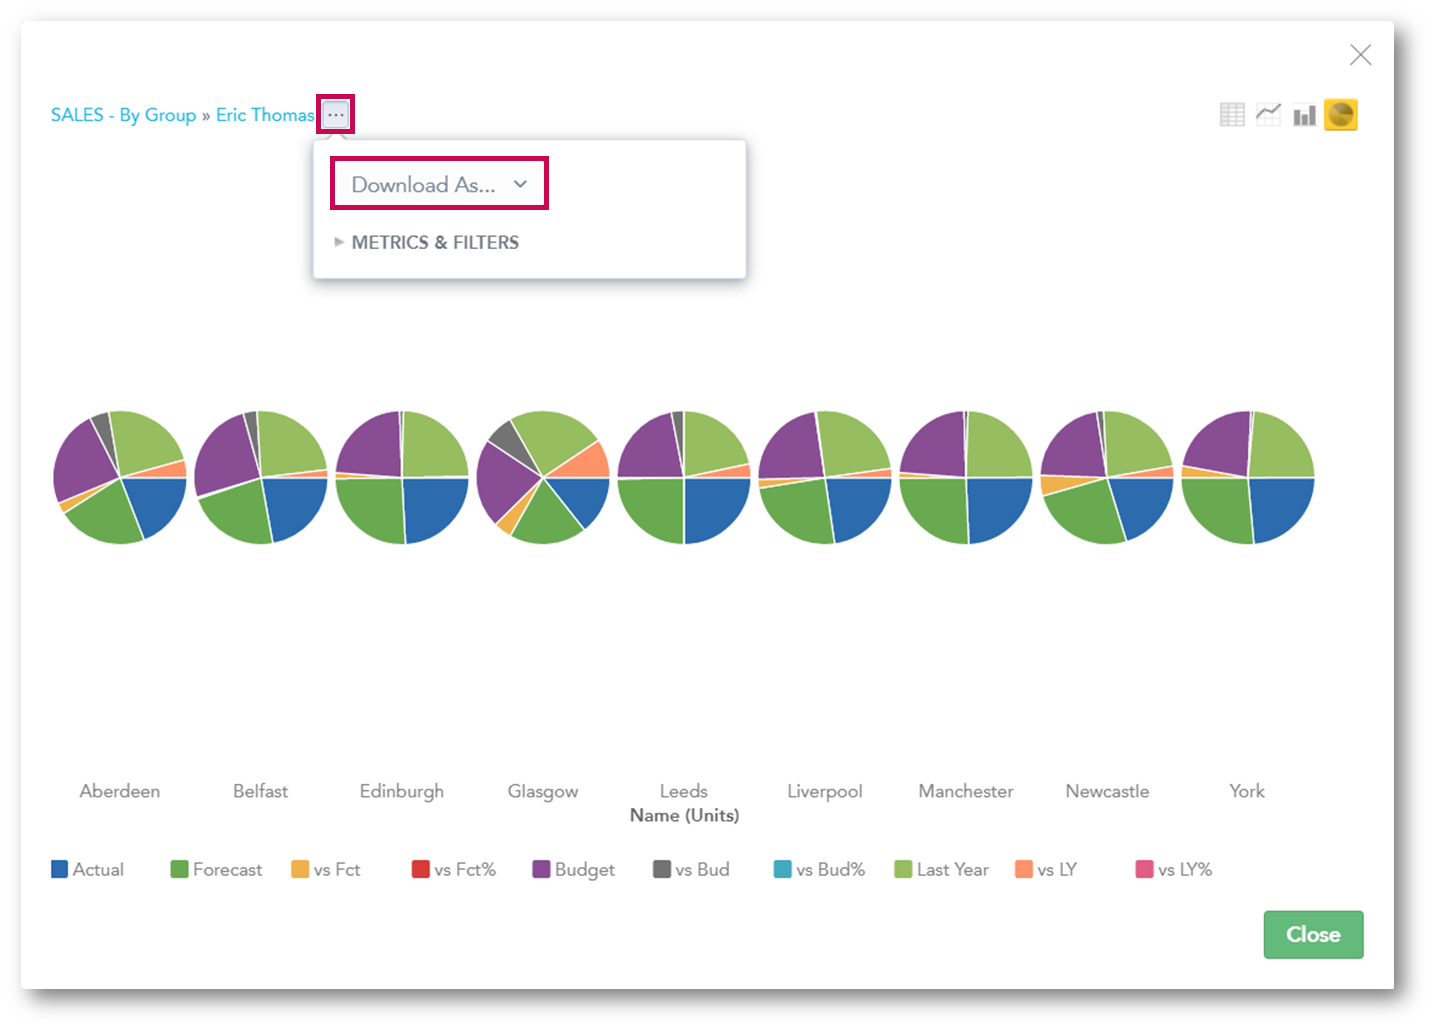
Fig.9 - Downloading a drilled-down report, bar chart view

Comments
Please sign in to leave a comment.