Menu Engineering Report
The Menu Engineering Report displays the analysis of sales for recipes and their performance compared to costs and profitability.To run the report
- Go to Report Center>Report Module: Recipe or go to Reports>Recipe Reports.
- Double-click the Menu Engineering Report or select the report and click Run Report, as per Fig. 01.
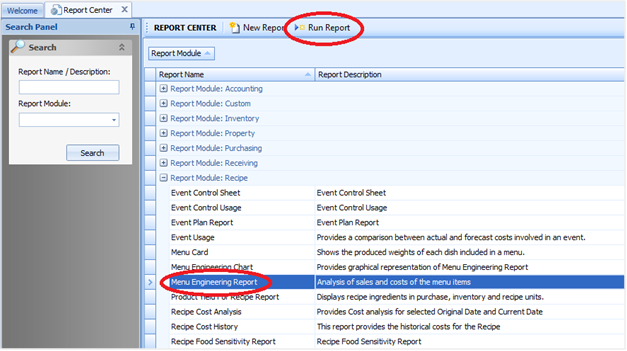
Fig.01 - Running the Menu Engineering Report
Report Criteria
Provide the following criteria to generate the report, as per Fig. 02: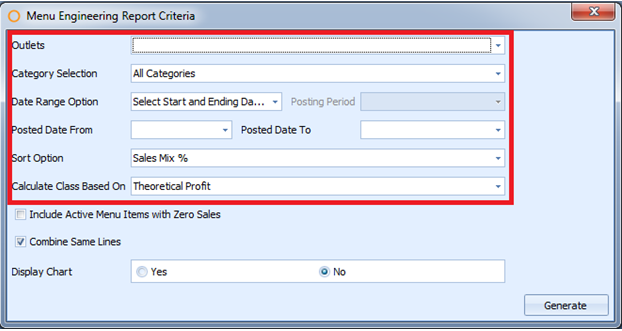
Fig.02 - Menu Engineering Report criteria
| Fields | Description |
|---|---|
| Outlet | In the Outlet list, select the desired Outlet(s). |
| Category Selection | In the Category Selection list, select the criteria for Categories, Recipes, or Products and with the option for All or Selected items. |
| Date Range Option | In the Date Range Option list, select either Start and Ending Dates or Date Range by Period option. After the selection has been made, select the corresponding Posting Period or Posted Date From and To options. |
| Sort Option |
In the Sort Option list, select from five options to sort the report:
|
| Calculate Class Based On |
In the Calculate Based On list, choose one of the following options:
|
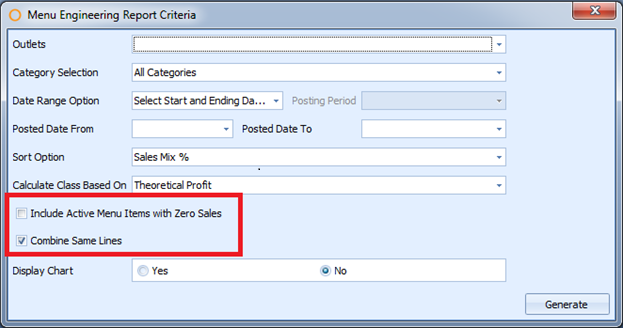
Fig.03 - Additional criteria for the Menu Engineering Report
| Fields | Description |
|---|---|
| Include Active Menu Items with Zero Sales | Select the Include Active Menu Items with Zero Sales check box to show any active items that do not have any sales with the current date range and category selections, as per Fig. 03. |
| Combine Same Lines | Select the Combine Same Lines check box to combine recipes with different costs using average cost for this line instead. This option is enabled by default, as per Fig. 03. |

Fig,04 - Display Chart and Menu Rating Option
| Fields | Description |
|---|---|
| Display Chart | Select Yes or No in the Display Chart box, as per Fig. 04. When set to Yes, the Menu Rating Options is available. |
| Menu Rating Options |
In the Menu Ratings Options list, select either All Menu Ratings or Individual Menu Ratings. Next is a numerical field to enter a count (default 10) which corresponds to the second drop-down box of Quantity Sold or Profit. When the report is generated, this will show each menu item in a graphical representation. Note: The Menu Rating Option is only available when Display Chart is set to Yes. |
Report Results
When the Menu Engineering report generates, it should look similar to Fig. 05: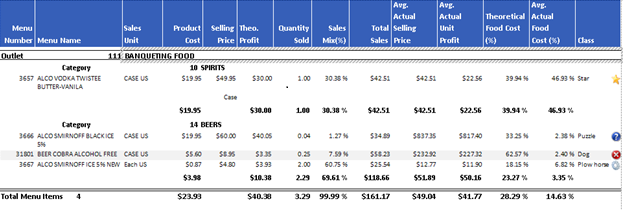
F
ig. 05 - Menu Engineering Report, sample results
| Fields | Description |
|---|---|
| Menu Number | Displays the menu item number, which is either a Recipe or Product number in Adaco. |
| Menu Name | Displays the Recipe or Product name. |
| Sales Unit | The unit used in the Recipe or Product for the sale of the menu item. |
| Product Cost | Displays the cost of the menu item. The Product Cost is calculated as follows:
|
| Selling Price | Displays the selling price of the menu item as it is set in the Recipe or Product screens. |
| Theo Profit |
Displays the Theoretical Profit of the menu item.
|
| Quantity Sold | Displays the number sold for the menu item based on the date range option chosen. |
| Sales Mix (%) |
Displays the percentage of the menu item as it compares to the rest of the outlets sales.
|
| Total Sales | Displays the total sales of the menu item for the outlet. |
| Avg. Actual Selling Price |
Displays the average selling price for the menu item in the outlet.
|
| Avg. Actual Unit Profit | Displays the average actual profit for the menu item in the outlet based on the Sales Unit.
|
| Theoretical Food Cost % |
Displays the food cost percentage based on the product cost and selling price in the outlet selected.
|
| Avg. Actual Food Cost % |
Displays the average actual food cost percentage based on product cost and average actual selling price in the selected outlet.
|
| Class | Displays the class performance of the menu item and is categorized in four classifications when generated on the “Calculate Class Based On” report criteria:
|
Display Chart
When the “Display Chart” report criteria is enabled (set to Yes), the generated report will display a graphical representation for each menu item, and is displayed according to class, as per Fig. 06.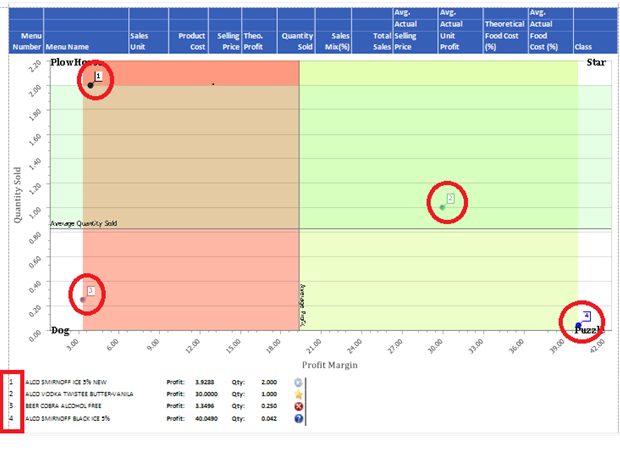
Fig.06 - Display Chart, sample results

Comments
Please sign in to leave a comment.