Inventory Coverage Report
The Inventory Coverage Report is used to give an idea how long the current stock will suffice with the current usage of the product. The report will capture Inventory vs. Usage for the selected time periods and calculate the number of days the current stock will cover. The report is to be used for determining future order quantities and frequency. It will also provide a gauge to evaluate dead/over stocked items based on the current inventory versus the average usage for the time period selected.
- To run the this report, go to Report Center > Inventory Reports > Inventory Coverage Report.
- To open the report criteria screen, double-click Inventory Coverage Report or select the report and click Run Report, as per Fig.1

Fig.1 - Running the Inventory Coverage Report
Report Criteria:
Enter report criteria below to get desired results, as per Fig.2.

Fig.2 - Report Criteria for the Inventory Coverage Report
| Fields | Description |
| Period Selection: |
From: ability to choose from all historical as well as current period. To: ability to choose from all historical as well as current period. |
| Start Date | Automatically filled-in field using the selected period's beginning date. |
| End Date | Automatically filled-in field using the selected period's ending date. |
| Report Selection |
All Products: generates the report with all products in the database. Selected Products: generates the report with only the chosen products. Selected Categories: generates the report with only the chosen categories. |
| Report Type |
Detailed: generates the report with values by period below product row. Summary: generates the report with the accumulated values for the selected time period. |
| Usage Frequency Filter | The filter for usage frequency will be applied by dividing the time periods' usage by the number of periods. That result will be divided by 30.42 - the average number of days per month - to calculate the Average Daily Usage. Daily: displays the Rounded Average Daily Usage greater than or equal to 7. Monthly: displays the Rounded Average Daily Usage less than 7 and greater than or equal to 1. Less Than Monthly: displays the Rounded Average Daily Usage less than 1. |
Report Results
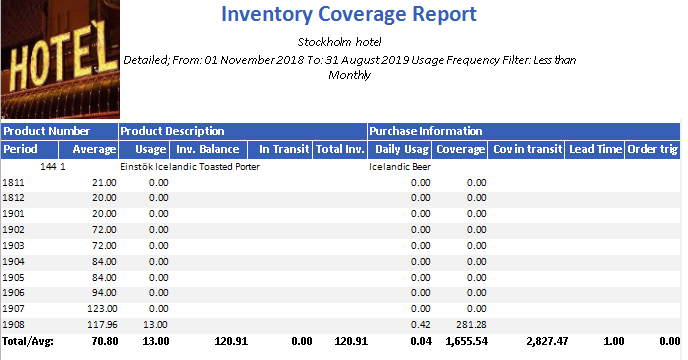
When the Inventory Coverage report is generated, the result should look similar to Fig.3.

Fig.3 - Inventory Coverage Report results
| Fields | Description |
| Product Number | The Adaco number followed by the detail number for the product. |
| Product Description | The name of the product. |
| Purchase Information | Displays what has been inserted in the Purchase Info field on the Product Master, located in Property > Products. |
| Period | The period year (YY) and month (MM). |
| Average | Displays the average Inventory Quantity for the selected Time Period. For the detailed report, displays the values for each period in the time period selected. |
| Usage | Displays the total value of issued quantities for outlet requisitions. For the detailed report, displays the values for each period in the time period selected. |
| Inv. Balance | The total inventory of the product within all outlets. |
| In Transit | Displays the accumulated Quantity on Order from open purchase orders. |
| Total Inv. |
The quantity of the product in the all the outlets.
|
| Daily Usage |
Displays how much of the product has been used depending on the Usage Frequency Filter calculation. For the detailed report,
|
| Coverage |
Displays how many days the current available stock will suffice.
|
| Cov in transit |
Displays how many days the total stock, which is the current inventory and open purchase orders.
|
| Lead Time | Based on the last receiving for the product, displays the difference, in days, between the PO Created Date and the Last Receiving Date. |
| Order trig |
Displays the difference when Lead Time is greater than Coverage in Transit, otherwise it will display 0.
|
| Total/Avg |
Average: displays the total average of the all the periods' averages. Usage: displays the sum total of all the periods.
|

Comments
Please sign in to leave a comment.