
Overview
This article lists and describes the most commonly used reports in FnB Manager. Select each report name from the list below to go straight to their details.
Report - Stock Reconciliation
Report - Accounting Figures
Report - Wastage Summary & Detail Report
Report - Purchase Analysis
Report – Site Transfer Summary
Report - Sales-mix Analysis
Report - Invoice/Credit Reconciliation
Report - Account Issues Report
Report - Actual vs Lowest Unit Cost
Report - Audit Report
Report - Management Figures
This report displays an overview of actual to theoretical GP comparison along with all aspects of the cost of sales. Also shows an overview of all activity in the period including; deliveries, transfers and supplier returns.
Fields Generated
- Opening stock value
- Total purchases approved
- Total supplier returns approved
- Total requisitions sent/ received
- Total site transfers sent/ received
- Total account transfers in/out
- Closing stock value
- Actual cost of sale (Open stock +/- transactions in and out- Closing stock)
- Actual POS sales
- Theoretical cost of sale (the cost of the recipe in the system X’s the actual sale of that recipe)
- Actual & Theoretical profit
- Actual & Theoretical GP
- Actual vs. Theoretical variance
Report View - Management Figures
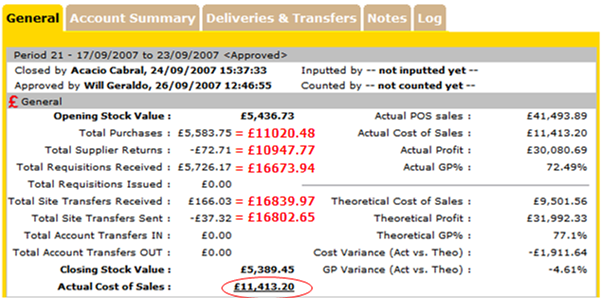
Fig 1 - Management Figures Report
Report - Product List
This report can list all products on the system, from all suppliers. It can also be filtered by single or multiple product categories and suppliers.
Report Filters
- Product Category
- Supplier
Fields Generated
- Product Name
- Suppliers
- Product ID
- Order Size
- Order Cost
- VAT
- Available
Report View - Product List
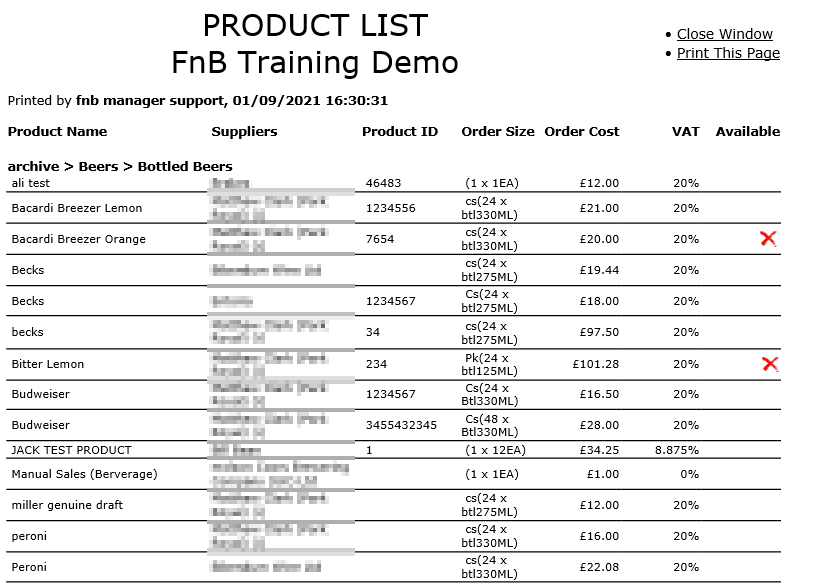
Fig.2 - Product List Report
Report - Stock Reconciliation
This report will highlight any stock variances on each of the stock items. It displaying all the relevant stock movement transactions entered into the system.
Report Filters
- Cost centre
- All products/ only those with differences
- Include batch sales and transfers
- Include items excluded from GP calculation
- Show closing value
- Show Bin No
- Use tolerance
- Export to Excel
Fields Generated
- Opening stock quantity
- Deliveries/Credits
- Transfers in and out of the site
- Closing stock quantity
- Usage quantity (Actual COS)
- POS sales quantities (Theoretical COS)
- Stock variances
- Stock variance in cost price terms
- Stock variance in the last period
- Stock variance in weighted average terms
Report View - Stock Reconciliation
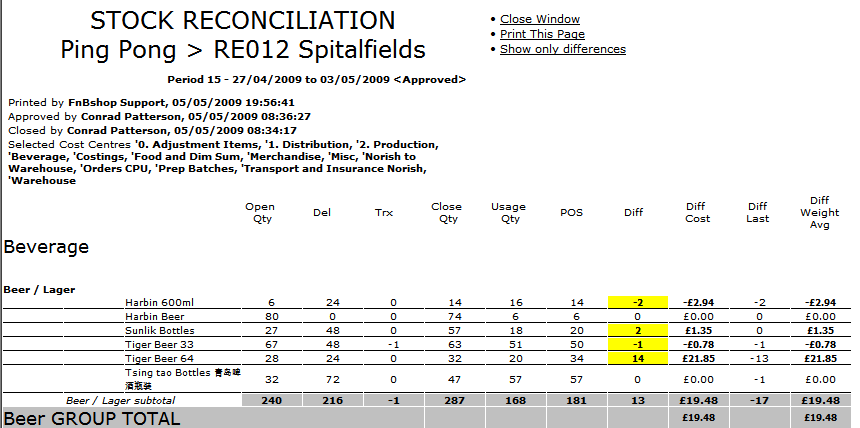
Fig.3 - Stock Reconciliation Report
Report - Accounting Figures
This report displays stock transactions at a category level using financial measures.
Report Filters
- Cost centre
Fields Generated
- Opening stock value (last periods weighted average closing value)
- Value of stock transfers in and out of site
- Value of stock transfers from site (only to accounts excluded from GP)
- Closing stock value (this periods closing stock weighted average value)
- Actual cost of sale
- Theoretical cost of sales
- POS sales value
- Actual GP
- Theoretical GP
- GP variance
Report View - Accounting Figures
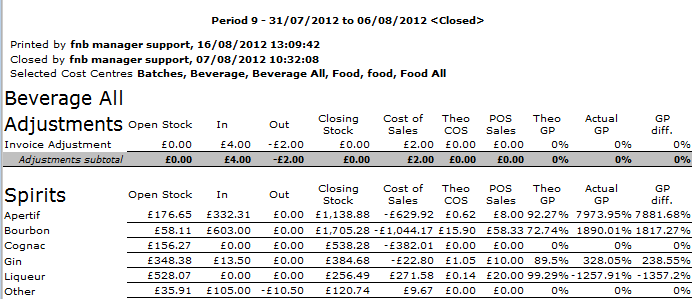
Fig.4 - Accounting Figures Report
Report - Wastage Summary & Detail Report
This report shows all wastage transfers allowing it to be broken down by quantity and value and details the date including reasons.
Report Filters
- Date
- Cost Centre
- Summary Type
- Issued from
- Valuation
- Account (s) Included in Cost Of Sales
- Report Destination (screen or export)
Fields Generated
- Site
- Wastage Account
- Date
- Category
- Product Code
- Product Name
- UOM
- Supplier
- Qty Wastage
- Wastage Value
- Reasons for Wastage
Report View - Wastage Summary & Detail Report
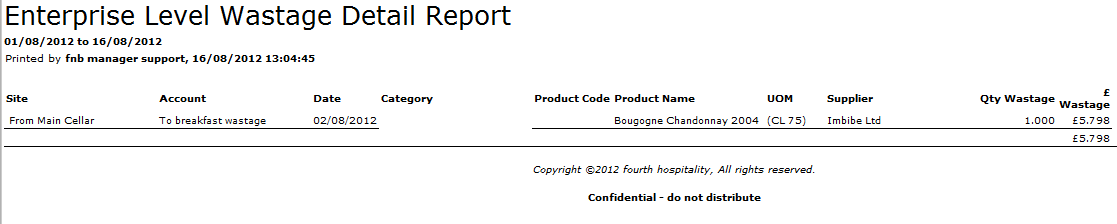
Fig.5 - Wastage Summary & Detail Report
Report - Purchase Analysis
This report breaks down all product purchases from all suppliers showing average cost price and total quantity and value of purchases for the organisation.
Report Filters
- Date range
- Unit
- Site
- Brand
- Supplier
- Display
- Sort by
- Vintage
Fields Generated
- Date
- Exported by
- Product name
- Supplier name
- Supplier product code
- Master product code
- Average cost price
- Quantity per location
- Total quantity purchased
- Total value purchased
Report View - Purchase Analysis
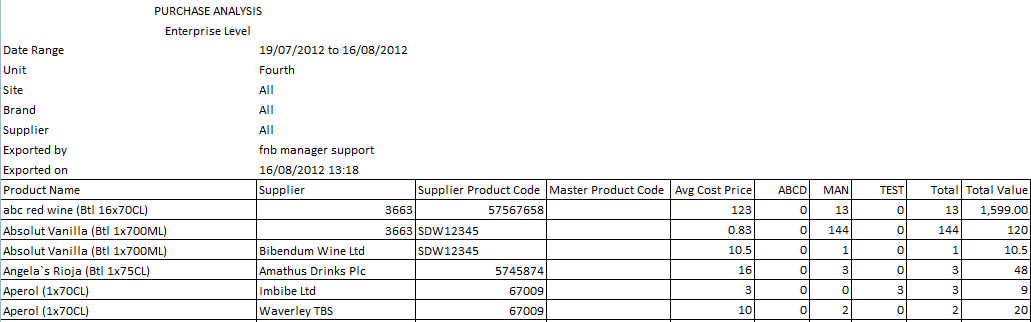
Fig.6 - Purchase Analysis Report
Report – Site Transfer Summary
This report displays the transfers from and to sites within the business. It can be broken down by category showing stock quantities.
Report Filters
- Date range
- Cost centre
- Detailed or summary
- Valuation / Quantity
Fields Generated
- Product category
- Product name
- Quantity into site
- Quantity out of site
- Site transfer total
Report View - Site Transfer Summary
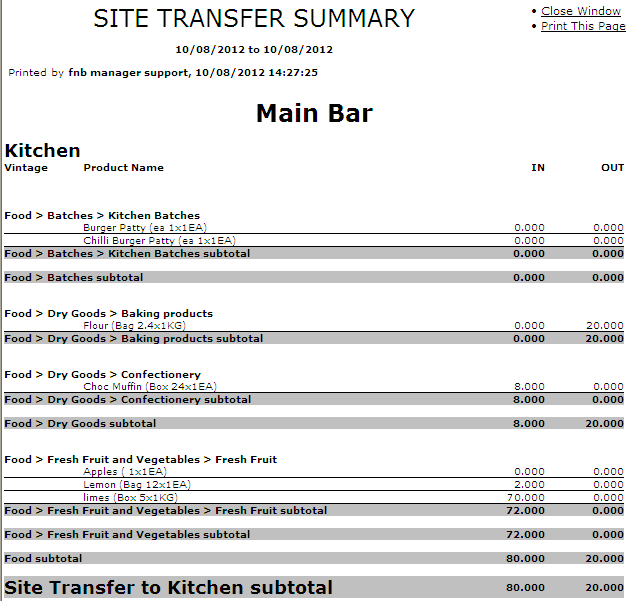
Fig.7 - Site Transfer Summary
Report - Sales-mix Analysis
Displays sales of all menu items on site within a time frame, whilst displaying the average cost price and selling price to give a % GP for the item as well the contribution in the menu group category and the difference between the GP % and the Target GP %.
Filters
- Date range
- Unit
- Site
- Brand
- Menu Group
- Display
- Sort by
Fields Generated
- PLU Name
- PLU Number
- Sales price
- Percentage of category sold
- Quantity sold at site
- Total Cost
- Total sales (net)
- Total sales (gross)
- % Gross sales of total
- GP %
- Target %
- Total Qty
- Total Value
Report View - Sales Mix Analysis
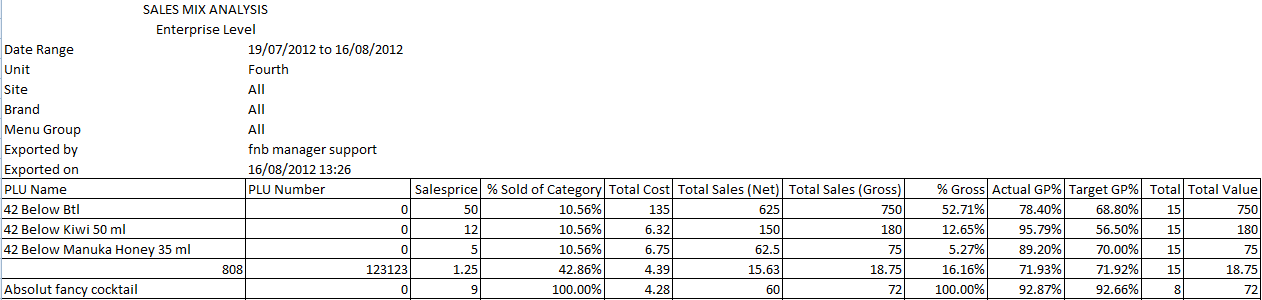
Fig.8 - Sales Mix Analysis Report
Report - Invoice/Credit Reconciliation
This report displays invoices/credits for each supplier per delivery/invoice, whilst providing a status of whether it has been approved into stock or marked for export.
Report Filters
- Supplier
- Delivery/invoice/credit number
- Delivery status
- Reconciled/partly/not
- Type – credit/invoice/all
- Date range
- Exported/marked/not
Fields Generated
- Date
- PO number
- Invoice date
- Invoice number
- Supplier
- Delivery number
- Total
- VAT
- Gross total
- Discrepancy
- Status
- Exported
- Invoice/credit total
Report View - Invoice/Credit Reconciliation
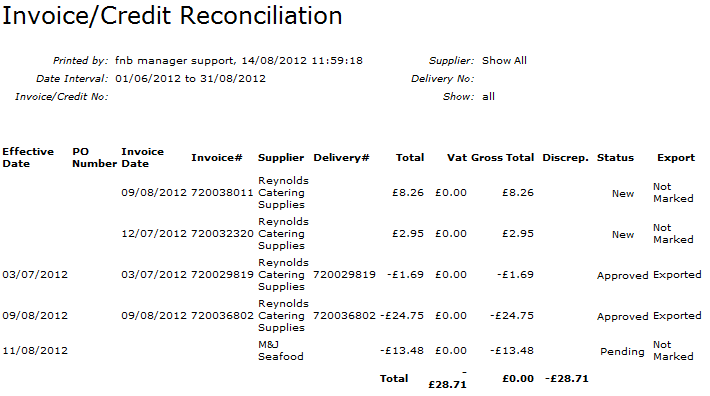
Fig.9 - Invoice/Credit Reconciliation
Report - Account Issues Report
This report displays all account transfers in and out of sites.
Report Filters
- Date range
- Cost centre
- Transferred in or out
- Site
- Valuation – cost price or weighted average
- Include cost of sales/not/both
Fields Generated
- Account
- Category
- Product
- Quantity
- Cost price
- Category total
- Total of all account transfers
Report View - Account Issues Report
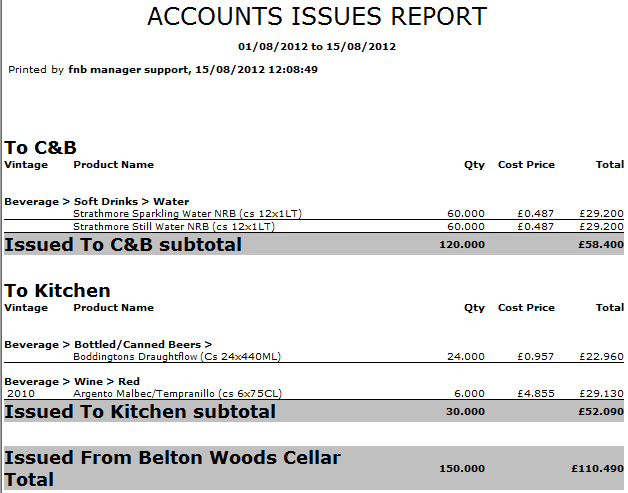
Fig.10 - Account Issues Report
Report - Actual vs Lowest Unit Cost
This report displays all products purchased at site (over a date ranger) and compares the price paid to the lowest possible cost price that could have been paid.
Report Filters
- Date range
- Unit
- Site
- Cost centre
Fields Generated
- Date
- Unit/site
- Cost centre
- Purchase date
- PO/invoice #/delivery reference #
- Product
- Supplier
- Cost
- Lowest unit cost supplier
- Lowest unit cost price
- Status
Report View - Actual vs Lowest Unit Cost
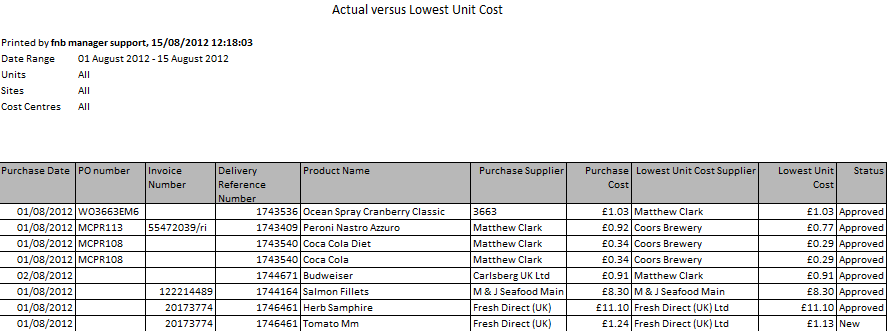 Fig.11 - Actual vs Lowest Unit Cost
Report - Audit Report
This report displays audit of changes, removal and creation on products, users, suppliers and recipes by whom and when.
Report Filters
- Date range
- Audit objects
- Actions
Fields Generated
- Objects/categories
- Date
- Users
- Name – product/user/supplier/recipe
- Action
- Detail of action
Report View - Audit Report
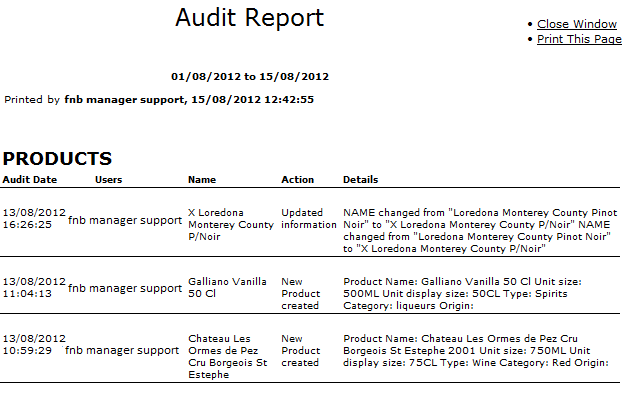
Fig.12 - Audit Report
Comments
Please sign in to leave a comment.