Overview
The Sales Forecast tab is used to review and update the sales forecast for the day, week or month.
For a list of all available Labour Based Scheduling articles, please visit: Labour-Based Scheduling: Getting Started
Process
- Select the Sales Forecast tab from the homepage
The Sales Forecast graph displays lines for last year’s sales, and the previous day’s actual sales. If the budget has been loaded, this will also be displayed here.
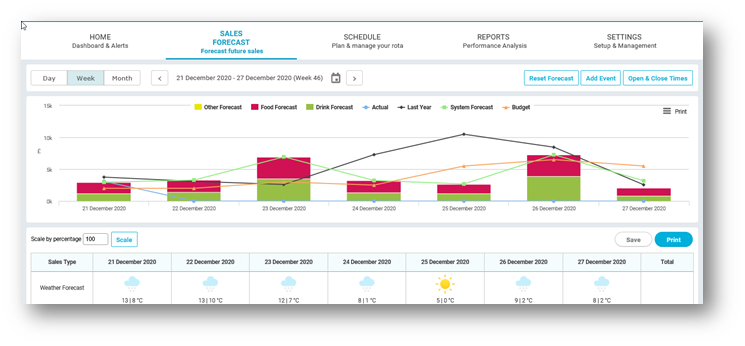
Fig.1 - Sales Forecast
- Below the graph, the sales Forecast is shown in free type fields. Forecasts can be amended and updated as required
As forecasts are inputted, the graph will display them against the day(s).
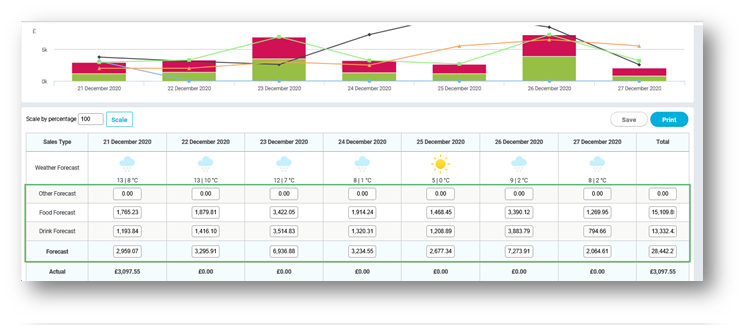
Fig.2 - Forecast sales (green bar) against a day, and free type forecast fields
The Budget (if uploaded), Actual and Last Year (if open that long) will also be displayed in monetary values.
The Weather Forecast specific to the location’s post code will be displayed on this screen.
- To update the Forecast use the free type fields against the relevant day(s) and enter the total monetary forecast figure for that day
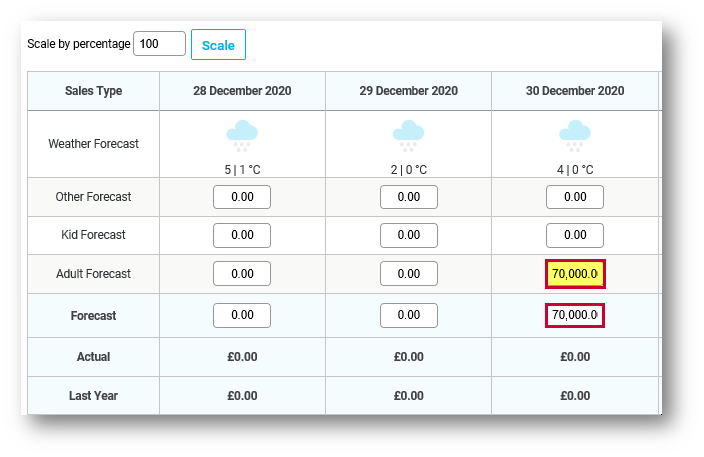
Fig.3 - Manually updating a day's Sales Forecast
When a new forecast has been entered, the box will change to yellow to show that a change has occurred. This can be done across the week, for the day, or for a sales type.
- After making changes to/creating a new forecast, select Save Forecast to update it
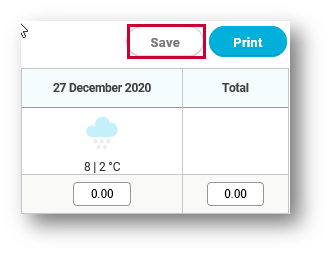
Fig.4 - The Save Forecast button
The graph will then be updated to reflect the forecast entered. It is not possible to re-forecast on the current day, or once the day has passed.
Forecasts can also be updated and viewed using the Day or Month view.
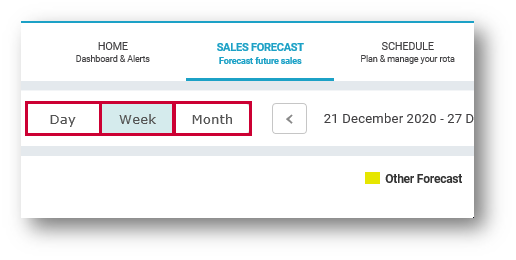
Fig.5 - Day, Week, Month view selection
By selecting Day view:
- The sales forecast can be viewed in half hour time slots throughout the day
- The graph at the top of the page will display the day’s actual sales and last year’s sales
- Any forecast Totals can be added at the bottom of the page
Any forecasts added can be viewed in time slots for the day, broken into half-hourly slots.
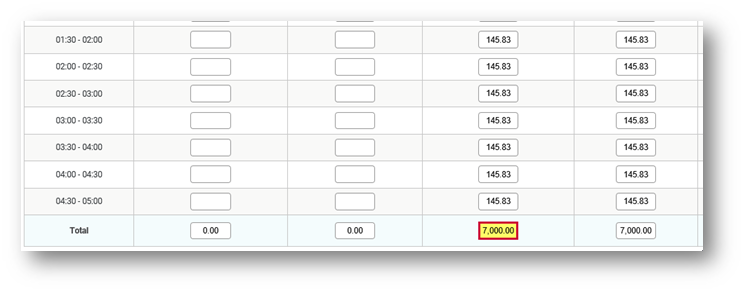
Fig.6 - Using the Day view - Total field highlighted at bottom
By selecting Month view:
- Trends and comparisons in the business can be viewed, both in the picture graph and table graph
- A forecast Total for the calendar month can be input, the same as with the Day view
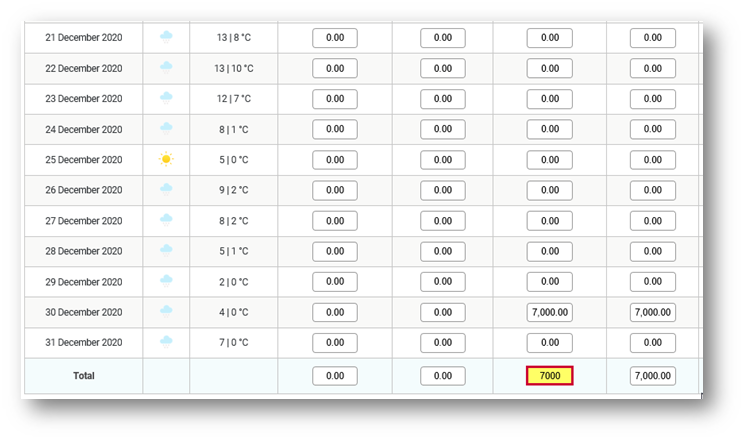
Fig.7 - Using the Month view - Total filed highlighted at bottom
- Selecting Save Forecast will split the total into an equal monetary value for each day for that particular calendar month
- On each of the views, a there is an option to Reset Forecast - this will reset the screen back to zero, and will reset the whole page of the view currently displayed
- To move to future or past weeks, select Next or Previous Week at the top of the screen, or by selecting specific dates with the calendar icon

Comments
Please sign in to leave a comment.