Overview
The Labour Based Scheduling product provides easy access to add forecasts, schedule employees, and to see how a business is performing. This article shows how to navigate through Scheduling from the Home Dashboard and provides information on the Demand Forecasting algorithm.
For a list of all available Labour Based Scheduling articles, please visit: Labour-Based Scheduling: Getting Started
- Go to Scheduling>Scheduling Homepage
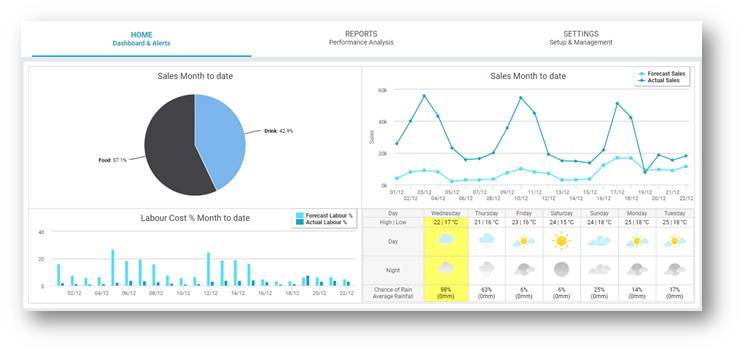
The homepage gives a selection of charts and graphs to provide an overview of the business.
- The pie chart shows sales figures, split by revenue stream if desired. Hovering over the pieces of the chart will show the amount of sales month to date for each revenue stream
- The line graph to the right shows a comparison of forecasted sales vs. actual sales month-to-date. This gives a quick snapshot of how accurately the business is forecasting on a day to day basis
- Labour cost % month-to-date is also shown in the bar graph. Once a schedule is set to Approve, the system uses snapshot functionally to compare and see consistency between Forecasted vs. Actual Labour costs
- Weather forecast information specific to the selected site's postcode is displayed

Fig.1 - The Homepage
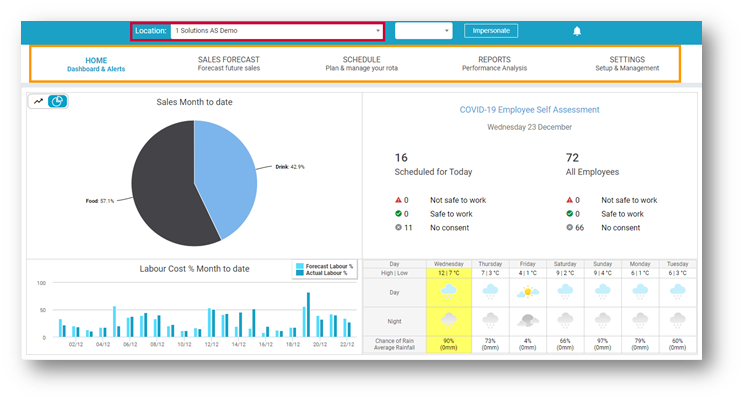
- Select a Location from the Location drop-down; more navigation options become available now.

Fig.2 - The Homepage after Location Selection
Sales Forecast - Forecast future sales
Forecasted sales can be edited and viewed here, through a weekly, daily and monthly viewpoint. Total sales, actual sales, budget sales and last year’s sales can also be viewed.
Schedule - Plan & manage your rota
Update, edit and view employees’ hours and view financial information on wage costs, available for wages, wage budgets and actual sales
Reports - Performance Analysis
Useful reports to supplement the Labour Based Scheduling Solution can be accessed from here.
Settings - Setup & Management
Depending on access permission. Changes can be made to the configuration of the Advanced Schedule product here.
A similar version of this article is available, without information relating to Demand Forecasting can be found here WFM - Labour Based Scheduling: Homepage
Homepage Changes after selecting a Location
If the Fourth Health Survey app is enabled, the available information on the homepage changes slightly once a location has been selected from the drop-down. For more information on the Health Survey app go here Health Survey app - User Guide - UK
-
- The line graph, previously shown on the right of the page, is now hidden within the sales pie chart section. You can toggle between the pie chart view and the line graph view by using the icon shown in Fig.3

Fig.3 - Sales Pie Chart & Line Graph Toggle
-
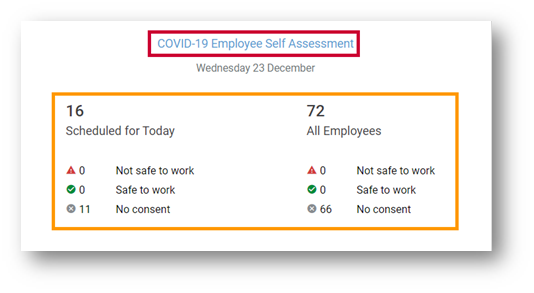
- The Covid-19 Employee Self Assessment section becomes available on the right of the page instead of the sales line graph as shown in Fig.4. Within this section, a quick report for each status for employees scheduled for today, as well as all employees is displayed. Select the section Covid-19 Employee Self Assessment to see a more detailed report.

Fig.4 - Covid-19 Employee Self Assessment
Understanding the Demand Forecasting Algorithm
The Demand Forecasting algorithm uses recent and historical site-specific historical and recent sales data to derive forecasted sales values, taking into consideration national events, any logged local events and weather conditions.
- The first data point used is from the previous year’s equivalent date. The system looks at the same day for 8 weeks both forwards and backwards
- The previous year's forecast is calculated by taking an average of the relevant data after excluding any outliers. An outlier is any day that falls outside of the business’ day-to-day sales trend
The next key data point is recent trends.
- Equivalent days in the 8 weeks prior to the date will be used to make the recent trend calculation. This is done site-by-site, by time slot, sales category, sales value and number of sales items, all fed over automatically from the till system
- Seasonality changes are also taken into account when moving from one week to the next. For example, when moving from December to January significant changes in sales would be expected
The next data point used is 'weather'.
- Weather forecast information is obtained by looking at each sites’ postcode or GPS coordinates
- Using all available historical data the system can generate a forecast purely based on weather. This is based on how precipitation levels and temperatures have impacted sales in the past
The last data point the system takes into account is national events.
- Standard UK national events are configured within the system. These include all Bank Holidays and special days such as New Years’ Eve and Valentine’s Day
- The system will understand the change in holiday dates. For example, if a Sunday in April is Mother’s Day, instead of looking at the equivalent day for last year, the system will look at the data for Mother’s Day last year. Likewise, if the Sunday this year is a normal Sunday, but the equivalent day last year was Mother’s day, the data from last year will be treated as an outlier
To generate a forecast 8 weeks into the future, the system will use its own historical forecasts to produce an optimum ratio for each site-specific business
The data points mentioned above are combined using this optimum ratio. This gives the business an accurate forecast based on live data.
For more information on the impact, Covid has had on the demand forecast go here WFM - Labour Productivity: Forecast Guidance, COVID-19

Comments
Please sign in to leave a comment.