
Overview
There are a number of reports within the system that are widely used across the customer base and provide information that can be used for business benefit. The reports outlined in this article include Management Figures, Stock Reconciliation, Accounting Figures, Wastage Details, Account Issues, Sales Analysis, Purchase Analysis, Closing Stock Summary, and Actual vs. Theoretical GP (Gross Profit). This article will go into further detail on what these reports entail.
Management Figures
This report displays an overview of the Actual to Theoretical GP (gross profit) comparison along with all aspects of the cost of sales. It also shows an overview of all activity in the period including; deliveries, transfers and supplier returns.
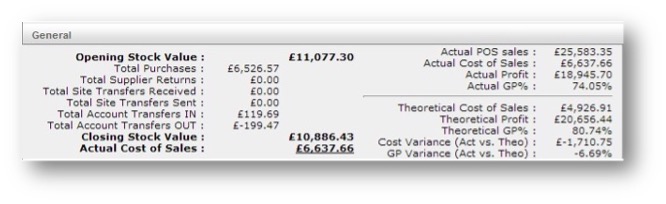
Fig.1 - Management Figures
- Opening Stock – Cannot be changed, this is the closing stock from the last period. By default, it’s the weighted average value
- Total Purchase – Total value of supplier purchases that have been approved into stock during the period
- Total Supplier Returns – Total value of supplier returns that have been approved out of stock during the period
- Total Site Transfers Received – Total value of site transfers received and approved during the period
- Total Site Transfers Sent – Total value of site transfers issued and approved during the period
- Total Account Transfers In – Total value of account transfers received and approved during the period, this includes things such as petty cash transfers (only appears on the report when affecting COS)
- Total Account Transfers Out – Total value of account transfers issued and approved during the period, such as staff food etc. (only appears on the report when not affecting COS)
 Best practice advises that Wastage is included in the cost of sales, therefore will not show in this entry, however, if wastage is not included, then this entry will show the wastage included.
 - Closing Stock Value – Total value of goods entered in the closing stock is by default the weighted average value
- Actual Cost of Sales = Opening Stock + Purchases - Returns +/- Transfers – Closing Stock
Actual GP
- Actual POS Sales – Total verified Net Sales from Epos i.e. the sales from the till that the system can read using the PLU numbers assigned to that site
- Actual Cost of Sales – Total cost to run the business during the period (as above)
- Actual Profit – Actual POS Sales – Actual Cost of Sales
- Actual GP – Actual COS/Actual POS expressed as a percentage
Theoretical GP
- Theoretical Cost of Sales – Quantity sold from total verified PLU’s multiplied by the recipe in the system using the assigned supplier price for the products in the recipe at that site.
E.g. PLU 123 sold 100 times. PLU 123 = 125ml champagne at Supplier A’s cost price of £1.30 per 125ml. PLU 123 x 100 x £1.30 = cost £130 theoretically.
- Theoretical Profit – Actual POS – Theoretical COS
- Theoretical GP - Theoretical COS/Actual POS expressed as a percentage
- Cost Variance – Theoretical COS – Actual COS
- GP variance – Theoretical GP – Actual GP
Stock Reconciliation
This report will highlight any stock variances on each of the stock items. It displays all the relevant stock movement transactions entered into the system.
Filters
- Stock period
- Cost Centre’s
- ‘Only variances’
- ‘Hide products not in use’
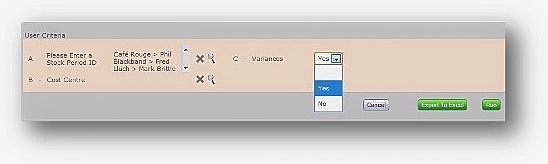
Fig.2 - Filters on the Stock Reconciliation
Fields Generated
- Opening stock quantity
- Deliveries/Credits
- Transfers in and out of the site
- Closing stock quantity
- Usage quantity (Actual COS)
- POS sales quantities (Theoretical COS)
- Stock variances
- Stock variance in cost price terms
- Stock variance in the last period
- Stock variance in weighted average terms
When the stock reconciliation report is generated the option is given to show only lines with variances or to show all references.
- Select Yes to only show variances
- Select No to show all products
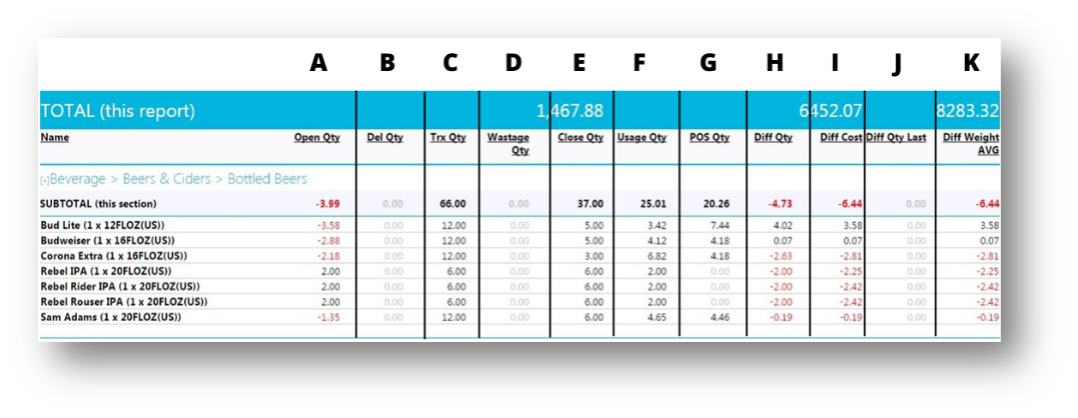
Fig.3 - Stock Reconciliation report
A. Open Qty – The closing stock value from the last period ![]() This cannot be changed
This cannot be changed
B. Del Qty – The quantity of product that has been delivered and approved into stock within the current stock period. ![]() Please note: This includes deliveries & return
Please note: This includes deliveries & return
C. Trx Qty - The total quantity of all approved transfers in and out of the site during the current stock period, this includes wastage, site transfers, and account transfers
D. Wastage Qty – The number of goods transferred to wastage
E. Close Qty – The closing stock quantity as per the stock count
F. Usage Qty – A + B +/- C- D
G. POS Qty – The total verified EPOS sales recorded against this product, this is the theoretical usage assuming the correct quantities have been used. This is according to the recipes in the system.
H. Diff Qty – The difference between POS (the theoretical value) and the Usage as per the stock count (the actual value)
I. Diff Cost – The difference between the actual and theoretical values in terms of cost
J. Diff Last – This is the stock difference of that product in the last stock period
K. Diff Weighted Average – This is the difference (column G) x Weighted average cost
Accounting Figures
This report displays stock transactions at a category level using financial measures.
Fields generated
- Opening stock value (last periods weighted average closing value)
- Value of stock transfers in and out of site
- Value of stock transfers from site (only to accounts excluded from GP)
- Closing stock value (this periods closing stock weighted average value)
- Actual cost of sales
- Theoretical cost of sales
- POS sales value
- Cash variance in actual & theoretical cost of sales
- Actual GP
- Theoretical GP
- GP variance
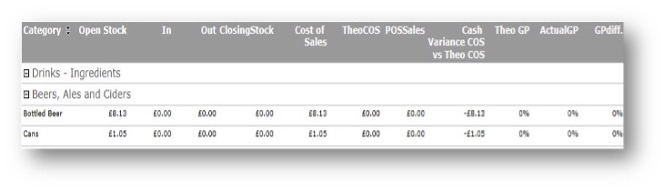
Fig.4 - Accounting Figures report
Wastage Details
This report shows all wastage transfers allowing it to be broken down by quantity and value, and details the date.
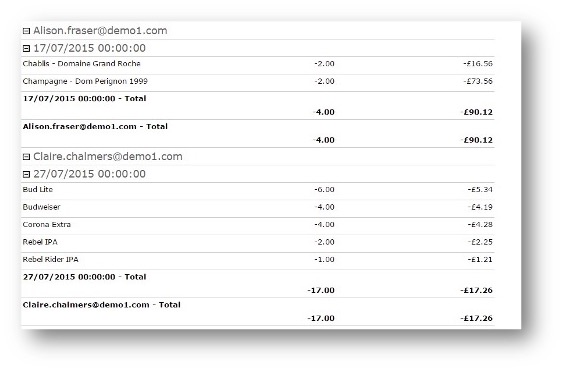
Fig.5 - Wastage details report
Account Issues
This report shows all transfers to both wastage and other accounts, such as cash purchases. The report breaks down the transfers in the products included, and will ‘explode’ recipes back to their products, the quantity and cost of each product are shown on the report.
Fields generated
- Product name
- Quantity transferred
- Cost price
- Total cost
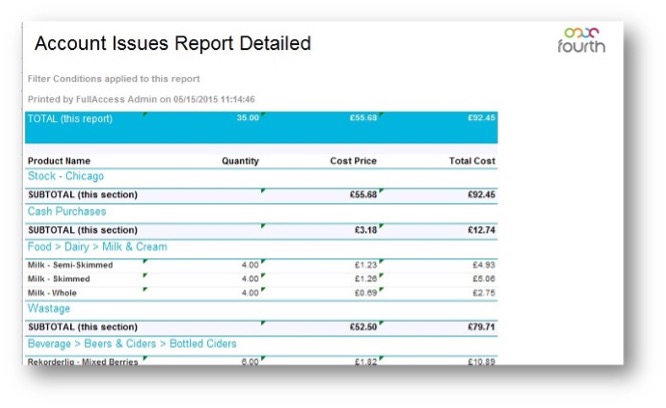
Fig.6 - Account issues report detailed
Sales Analysis Report
This report shows the sales quantity, cost, and revenue for each menu item across a defined period.
Fields generated
- Menu Item Name
- PLU Reference Number
- Quantity Sold
- Percentage Sold of the Menu Item Category
- Net Cost of the Menu Items Sold
- Net Sales of the Menu Item
- Average Net Sales Price
- Percentage Sold of Net Sales
- GP Percentage
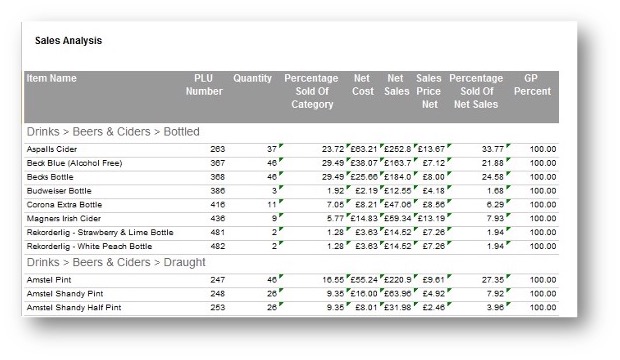
Fig.7 - Account Issues Report Detailed
Purchase Analysis
This report shows the details of each delivery or return that has been recorded in the system. The product details, delivery note number, invoice number and receipted date are displayed.
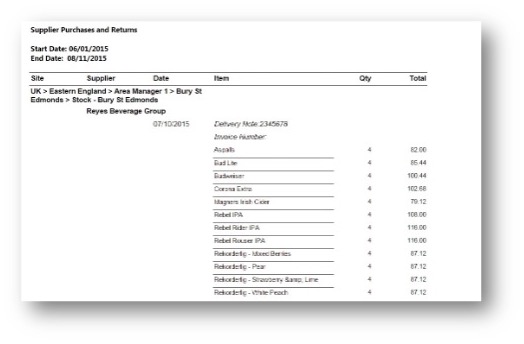
Fig.8 - Purchase Analysis Report
Closing Stock Summary
This report shows the closing stock value separated by the cost centre across multiple stock locations.
Filters
- Stock Period(s)
Fields generated
- Unit code
- Unit name
- Cost Centre
- Closing Stock value

Fig.9 Closing Stock Summary
Actual vs. Theoretical GP
This is a consolidated report of the key management figures across multiple stock locations.
Fields generated
- Net sales
- Cost of sales
- Gross profit (GP)
- GP percentage
- Theoretical cost
- Theoretical profit
- Theoretical GP
- Cost of sales variance
- GP percentage variance
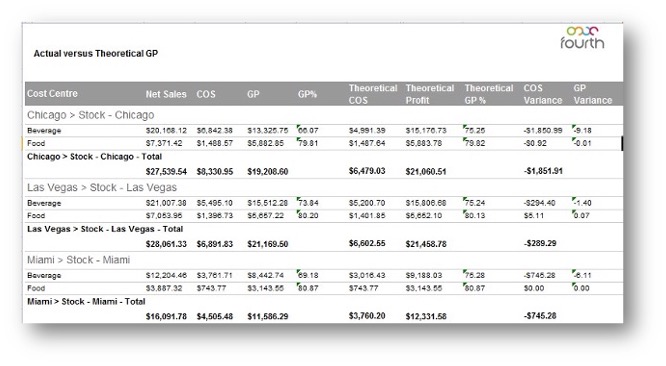
Fig.10 - Actual vs. Theoretical GP
Comments
Please sign in to leave a comment.