The Reconciliation Report

Fig 1 - Stock Reconciliation Report (Exported Version)
The Stock Reconciliation report is used to reconcile stock quantities by showing stock movement and any quantity differences between the calculated usage and the quantity sold (POS).
This reports main focus is on the quantity of the goods. It tracks the actual stock movements (actual Usage) and compares it to the theoretical stock movements according to the POS figure (theoretical Usage) and highlights where there is a difference. This difference is given a monetary value.
- The cost of the difference (Diff Cost) is then calculated as follows:
- The cost of the difference using the weighted average (Diff Weight AVG) is:
There are several reasons for differences in stock:
- Unaccounted for stock
- Incorrect opening stock
- The closing stock was entered incorrectly
- All transactions relevant to the stock period have not been approved or entered incorrectly
- Changes to an items unit size during the stock period
- The PLU’s on the EPOS are linked with the incorrect recipe in the system
- Sales have not been imported or verified to pick up all the costs and Net Sales
- Cross-ringing on the tills
- The recipes are not up-to-date
The differences in stock contribute to differences between the actual and theoretical cost of sales, however it is not the sole reason for the differences.
Management Figures
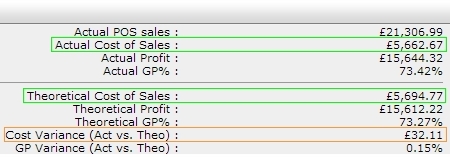
On the Management Figures there are two calculations that need to be understood Actual Cost of Sales & Theoretical Cost of Sales.
- Actual Cost of Sales:
- Theoretical Cost of Sales:

Fig 2 - Management Figures
The ‘Cost Variance (Actual vs. Theoretical)’ figure shows the total variance for the stock period.
The calculations above shows that there are various things that can cause differences, along with reasons for stock differences, they include:
- Transfers to accounts that affect GP% for example wastage
- Differences between the Weighted Average Start & Weighted Average End values
- Goods being receipted at a different price than the configured unit cost price
- The goods are purchased from a supplier that is not the designated supplier of that product on that site
This means that the stock reconciliation can have a perfect stock i.e. no variances but there can still be a difference between the actual and theoretical COS.
Fig 3 shows a stock reconciliation with no missing stock but because the product was transferred to wastage (which affects the COS) this will increase the actual COS by the value of the product. As there are no POS figures (this drives the theoretical COS) then this is a difference that can be seen on the Accounting figures and Management Figures but not the stock reconciliation.
Fig 3 - Stock Reconciliation with No Variance
Accounting Figures Report
The accounting figures report is used to display the value of the goods in the stock.
- The Opening Stock value is a reflection of the opening stock qty (x weighted average).
- The In column represents all movement of stock in that has affected the COS (this is deliveries + site transfer IN + account transfer IN that affects COS).
- The Out column represents movement of stock out (this is supplier returns + site transfer OUT + account transfer OUT that does NOT affect COS)
- The Closing Stock value is a reflection of the closing stock qty (x weighted average).
This report is the monetary representation of the transactions that were carried out within a stock period, broken down by category. It is basically the Management Figures report flipped on its side and shown in more detail. It is driven by the user actions carried out within the stock period.
Fig 4 shows that the category ‘cans’ has an Actual COS of £1.05 but no theoretical COS. This is because the product in Fig 3 was transferred to wastage which affects the COS. This demonstrates that there can be no variance on the stock reconciliation but a difference on the accounting figures.

Fig 4 - Accounting Figures Report
The main focus for a manager should be on ensuring the stock reconciliation is as accurate as possible. This will ensure the Actual and Theoretical COS figures can be trusted to be as accurate as possible

Comments
Please sign in to leave a comment.