Each week you can use the Generate Forecast tool to help predict your store’s earnings, and automatically populate that week’s sales projections, using past sales figures.
To start generating a forecast, hover over the Forecasting tab and click on Forecasting and Labor. Once the page loads click Create Sales Forecast in the appropriate week.
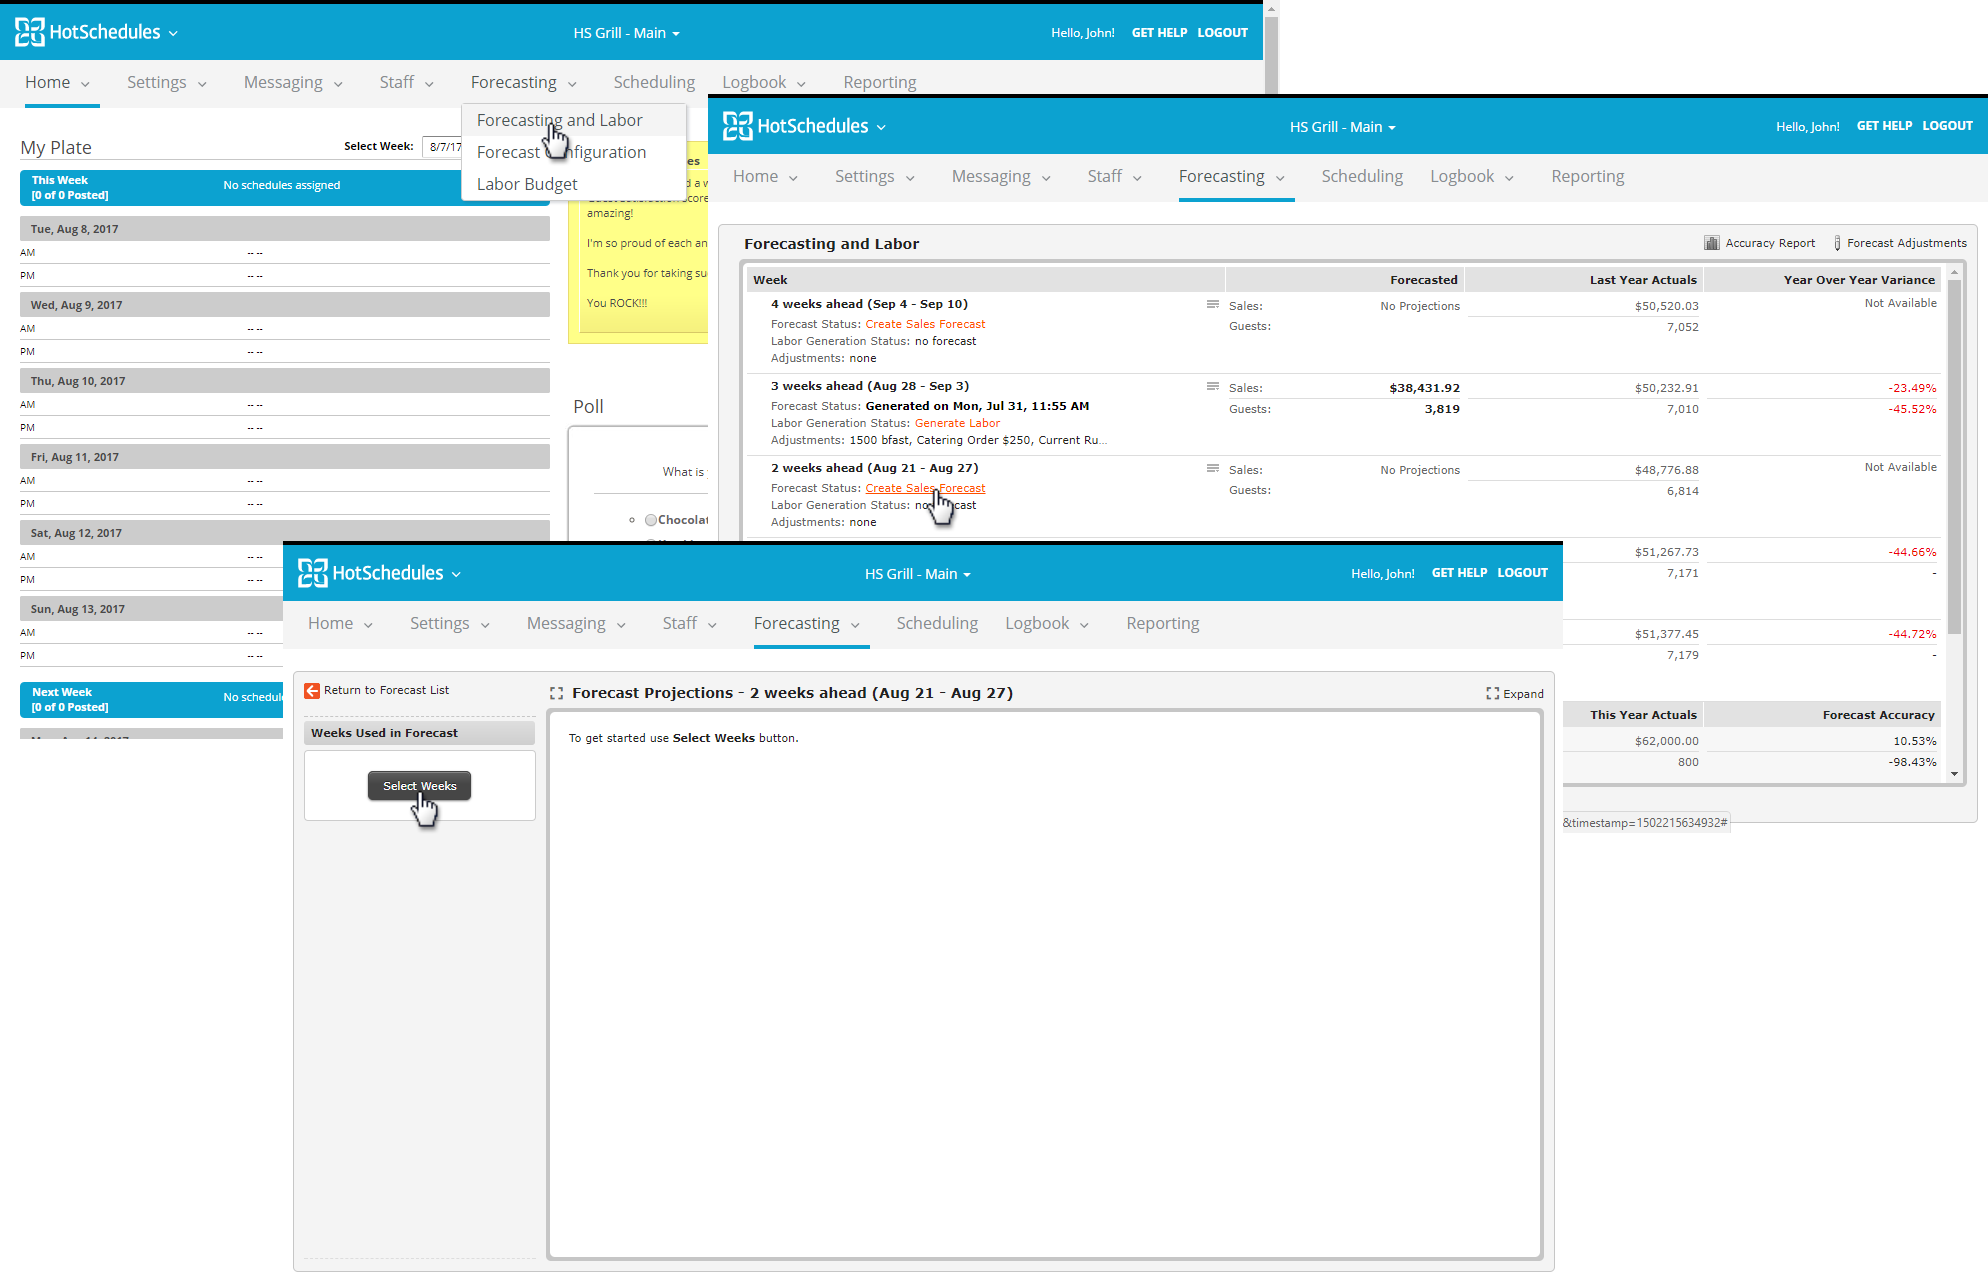
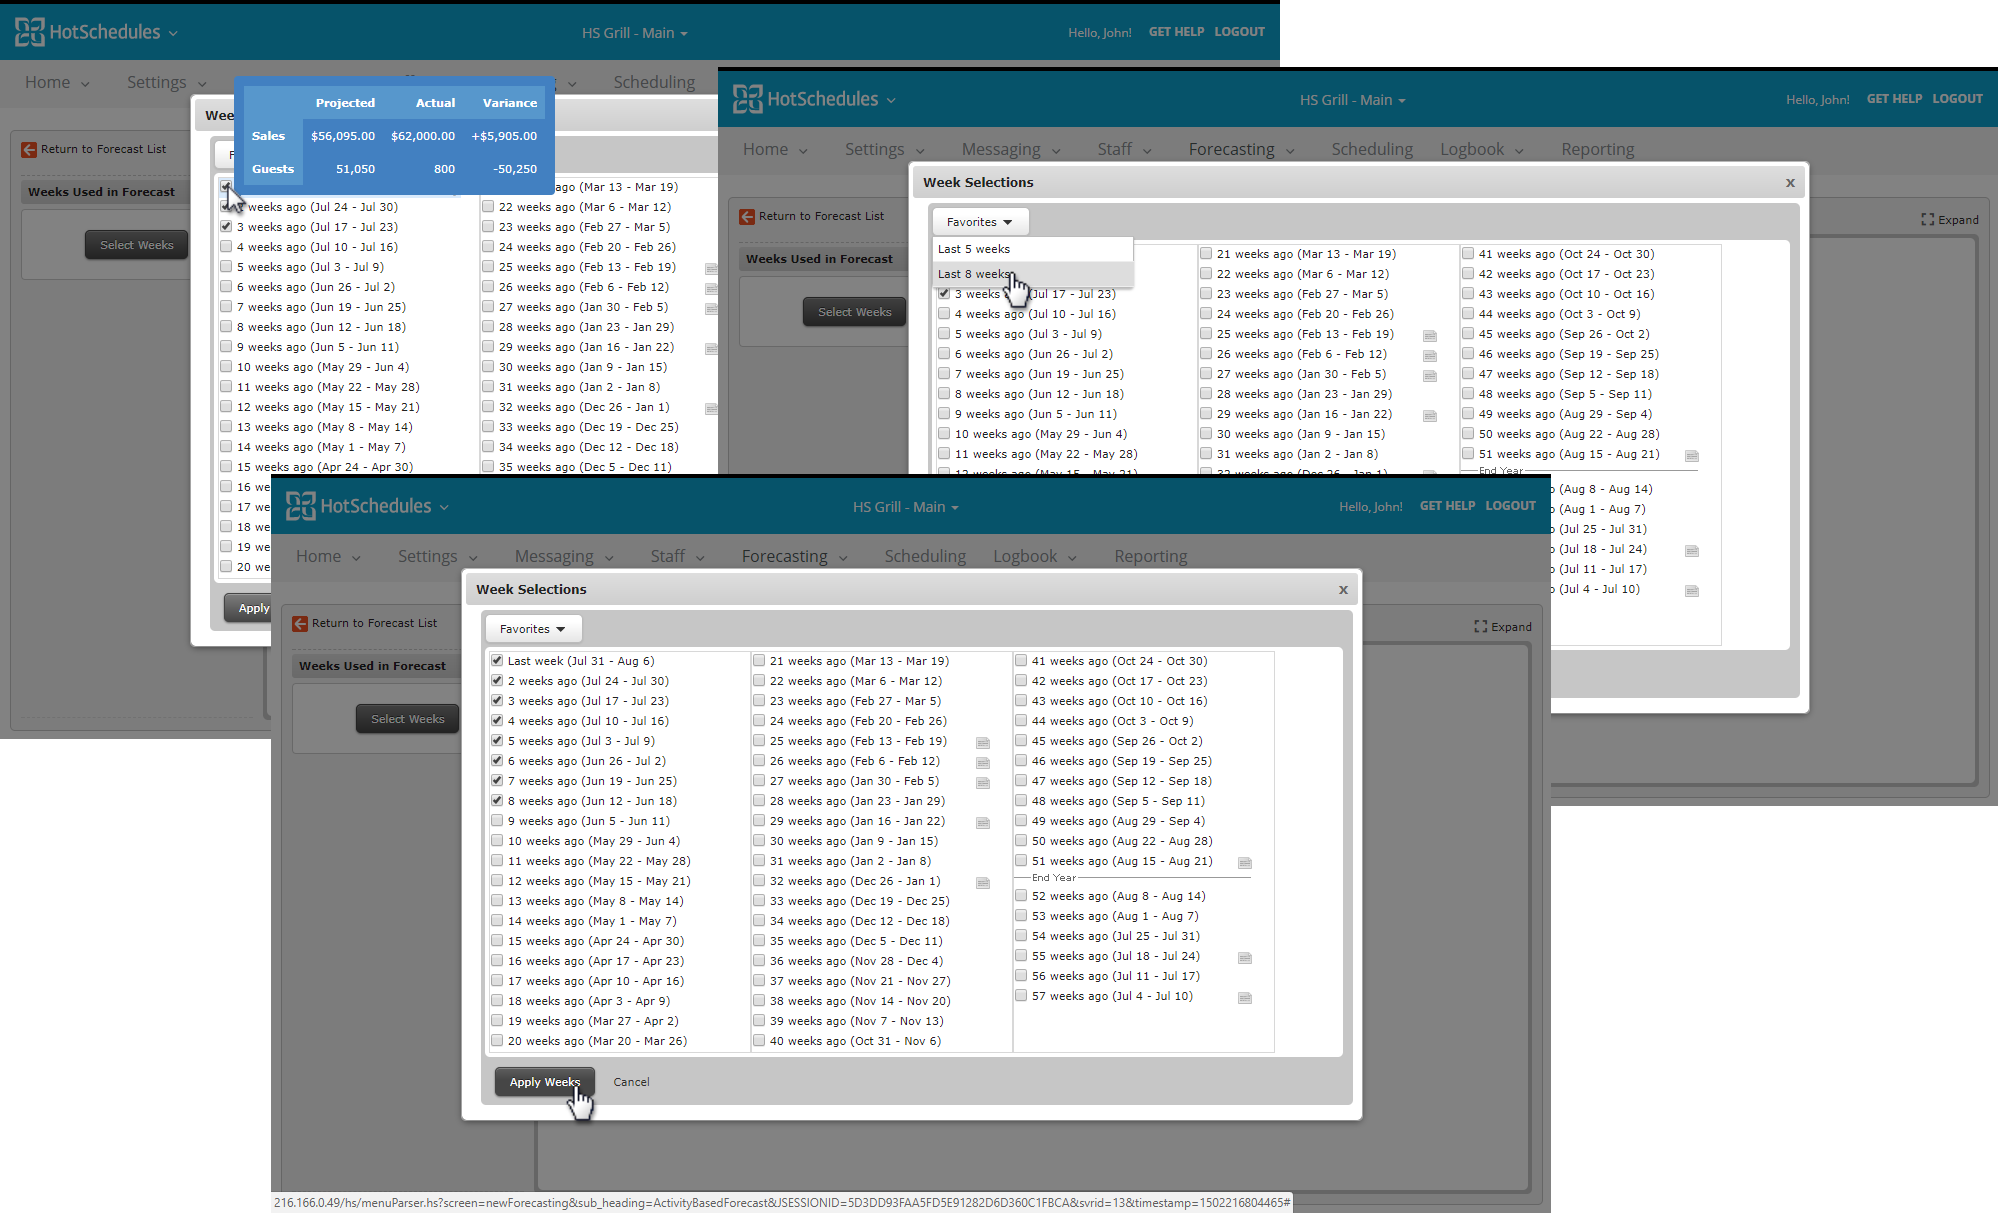
In the window that appears, check the box next to each week you’d like to use in your forecast. You must use at least 5 weeks. You can also select one of the options under Favorites, as well.
When finished, click Apply Weeks.
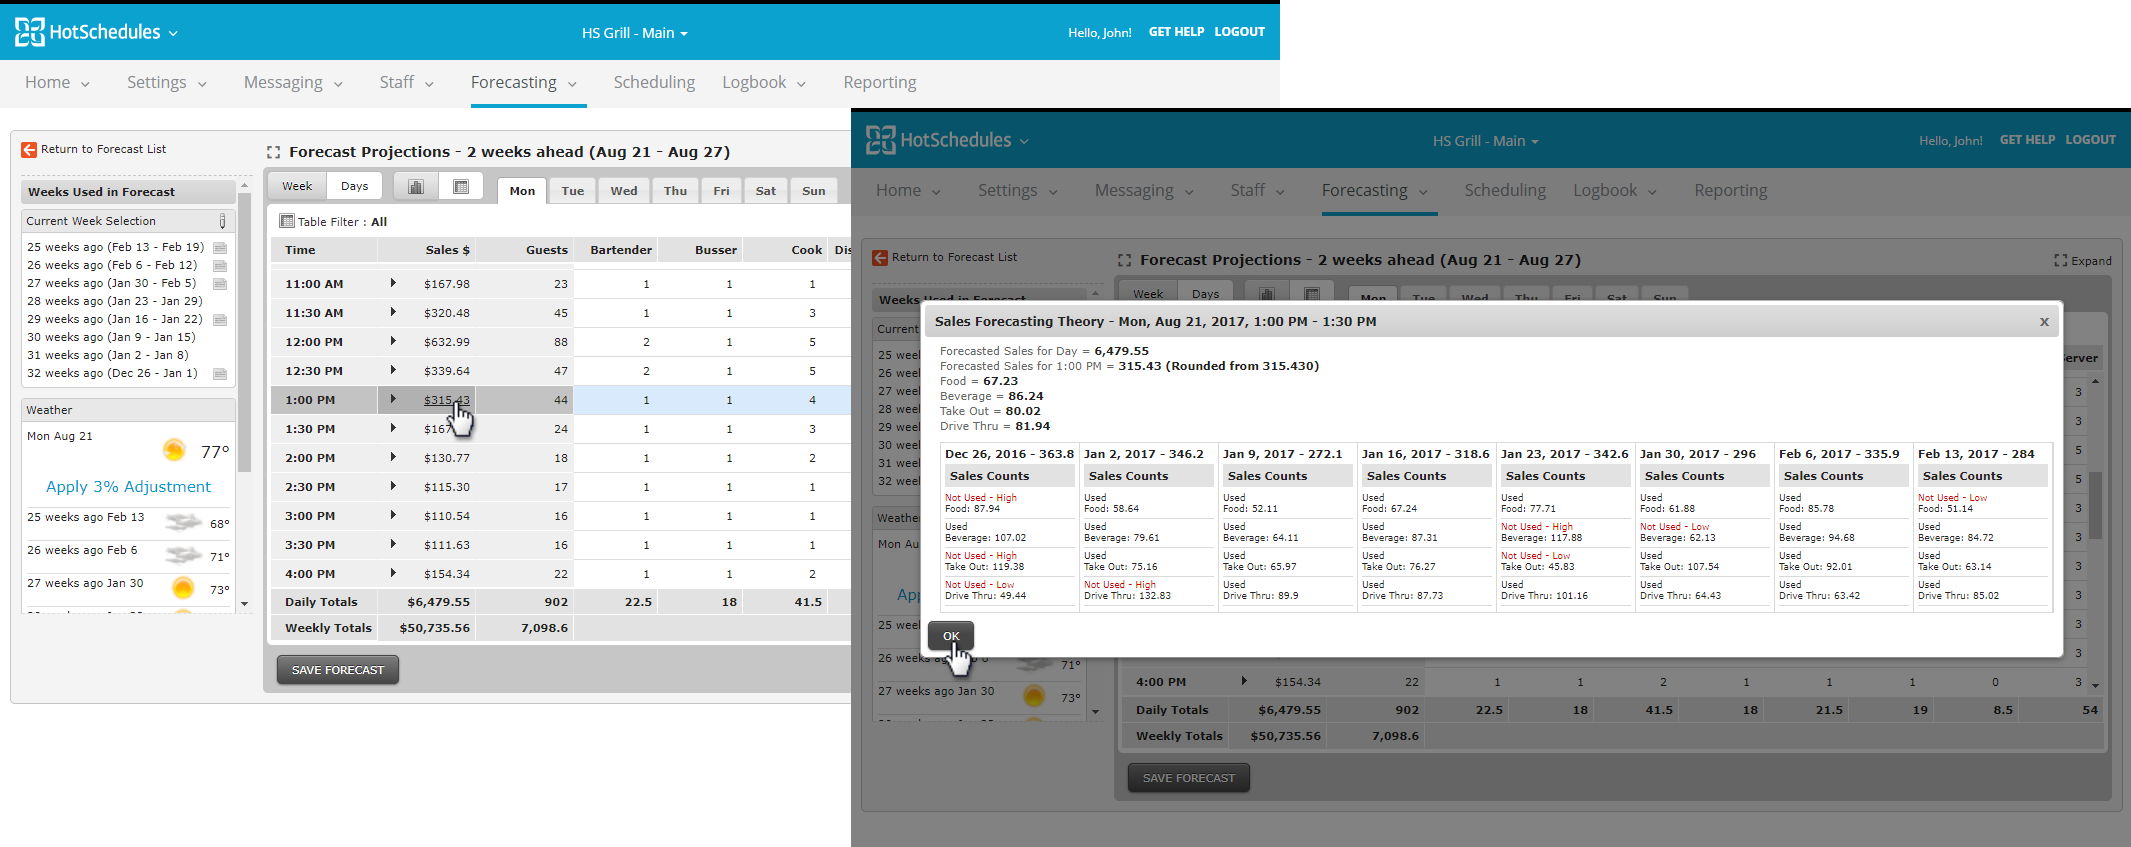
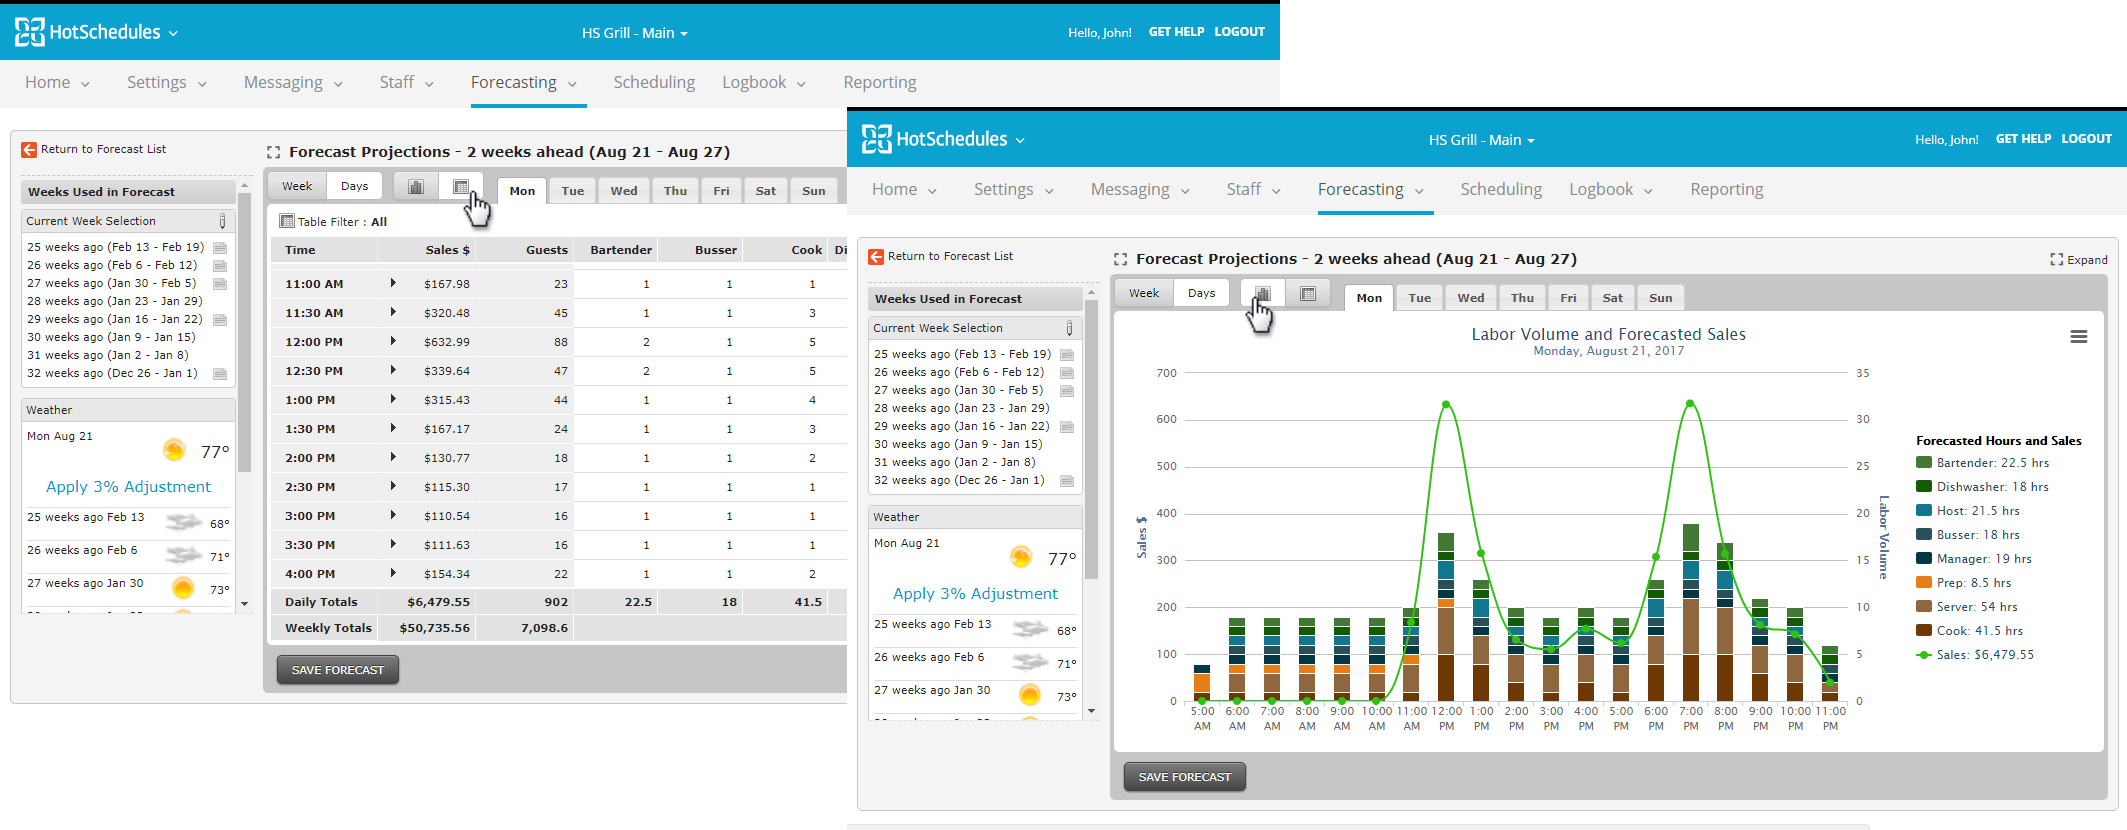
You will see the forecast for each day broken down into half-hour increments by default. You can see how each figure was derived by clicking the number.
This information is displayed by individual days, click on a specified day to see the breakdown. You can swap between a week view and day views.
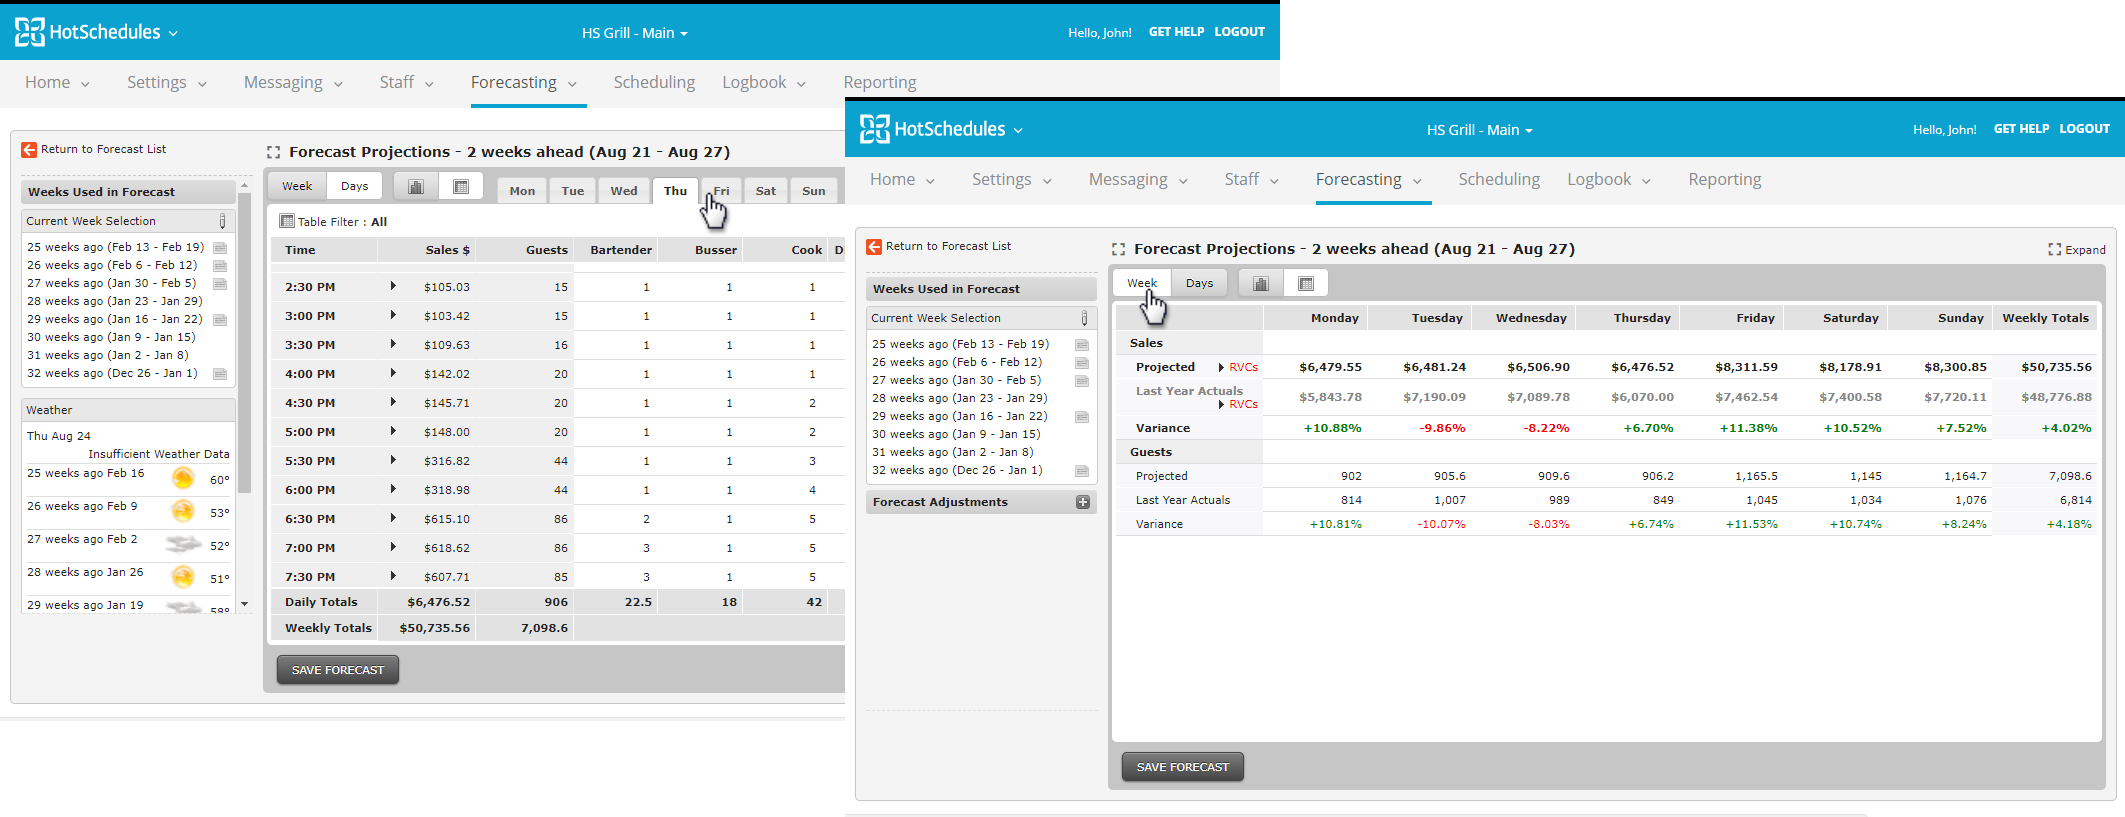
Switch between numerical and graphical views with these buttons.
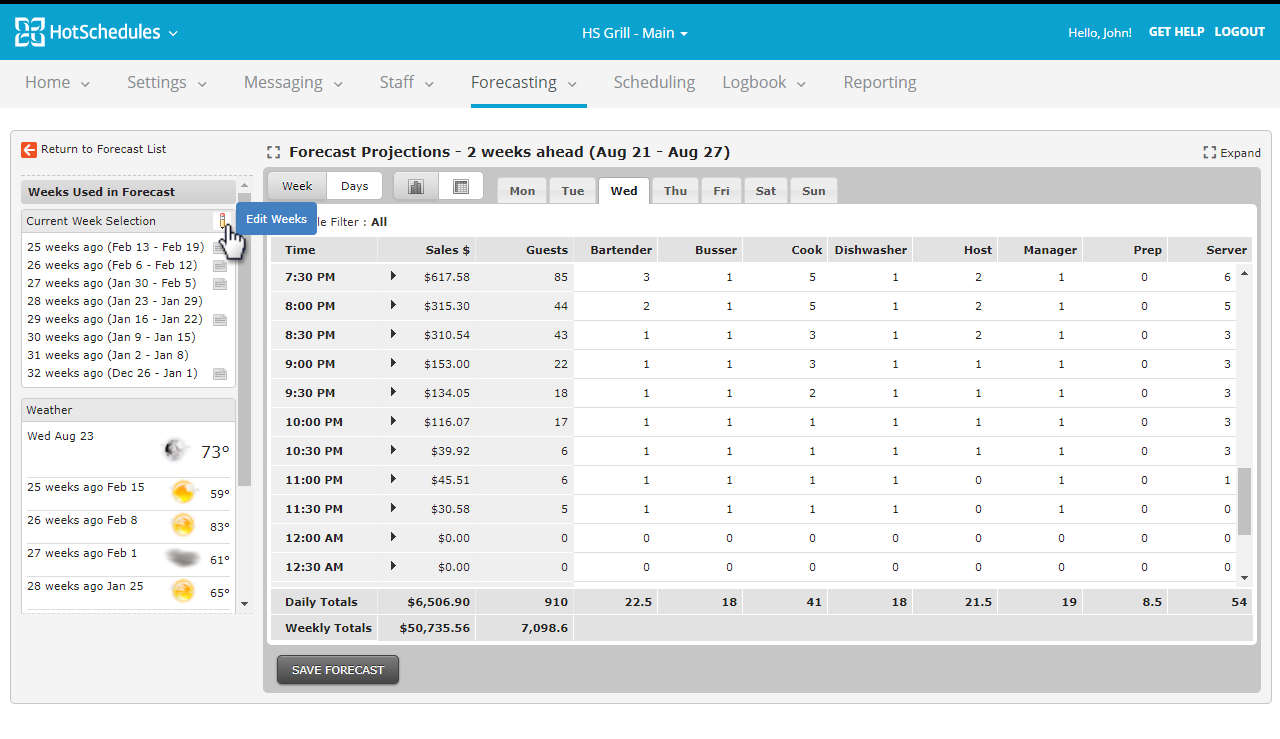
Edit which weeks used by clicking the pencil icon next to Current Week Selection.
Adjustments
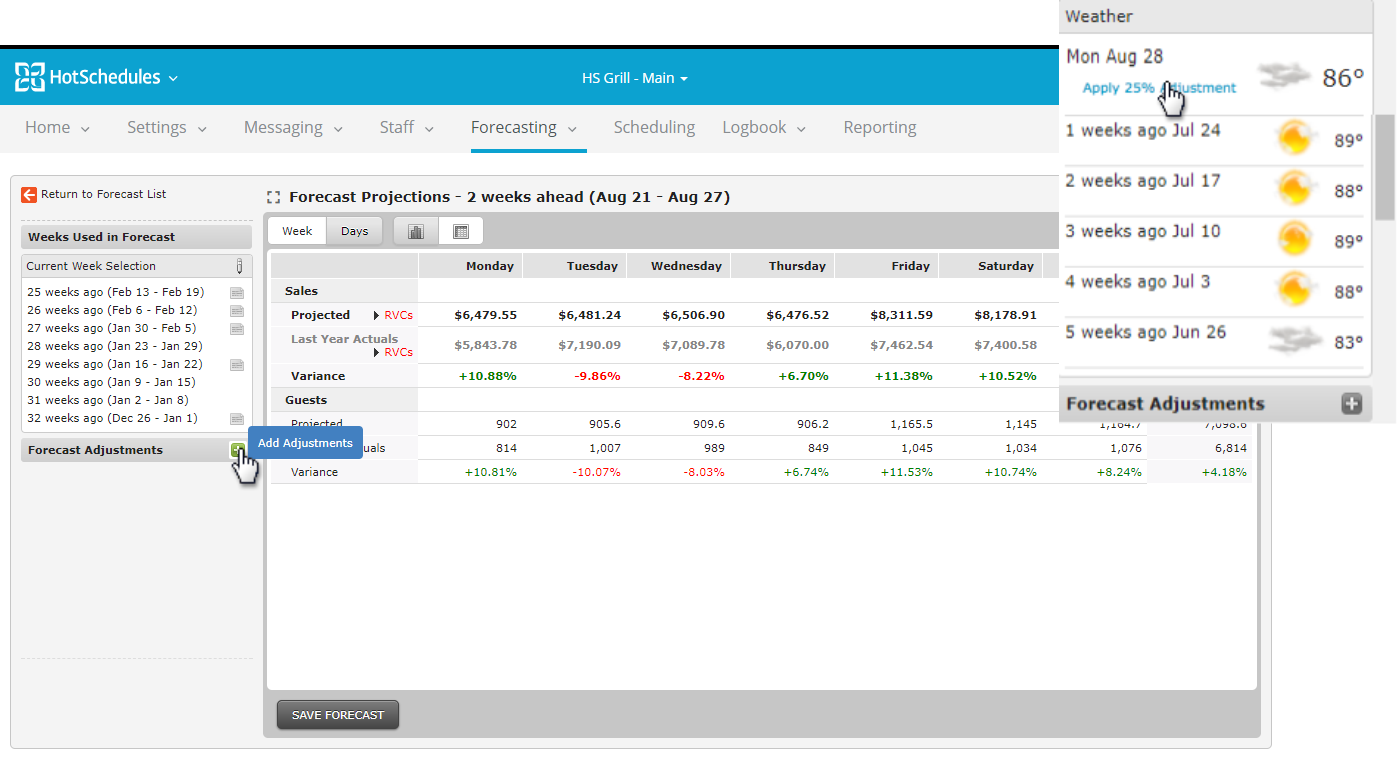
If there are special circumstances that may affect your sales, you can add adjustments to the forecast. For example, weather may play a factor in your sales. The Weather Widget will provide weather information for your forecast, and even suggest adjustments based on past sales figures. Simply click the suggestions to apply the adjustment.
For all other adjustments, click Add Adjustments.
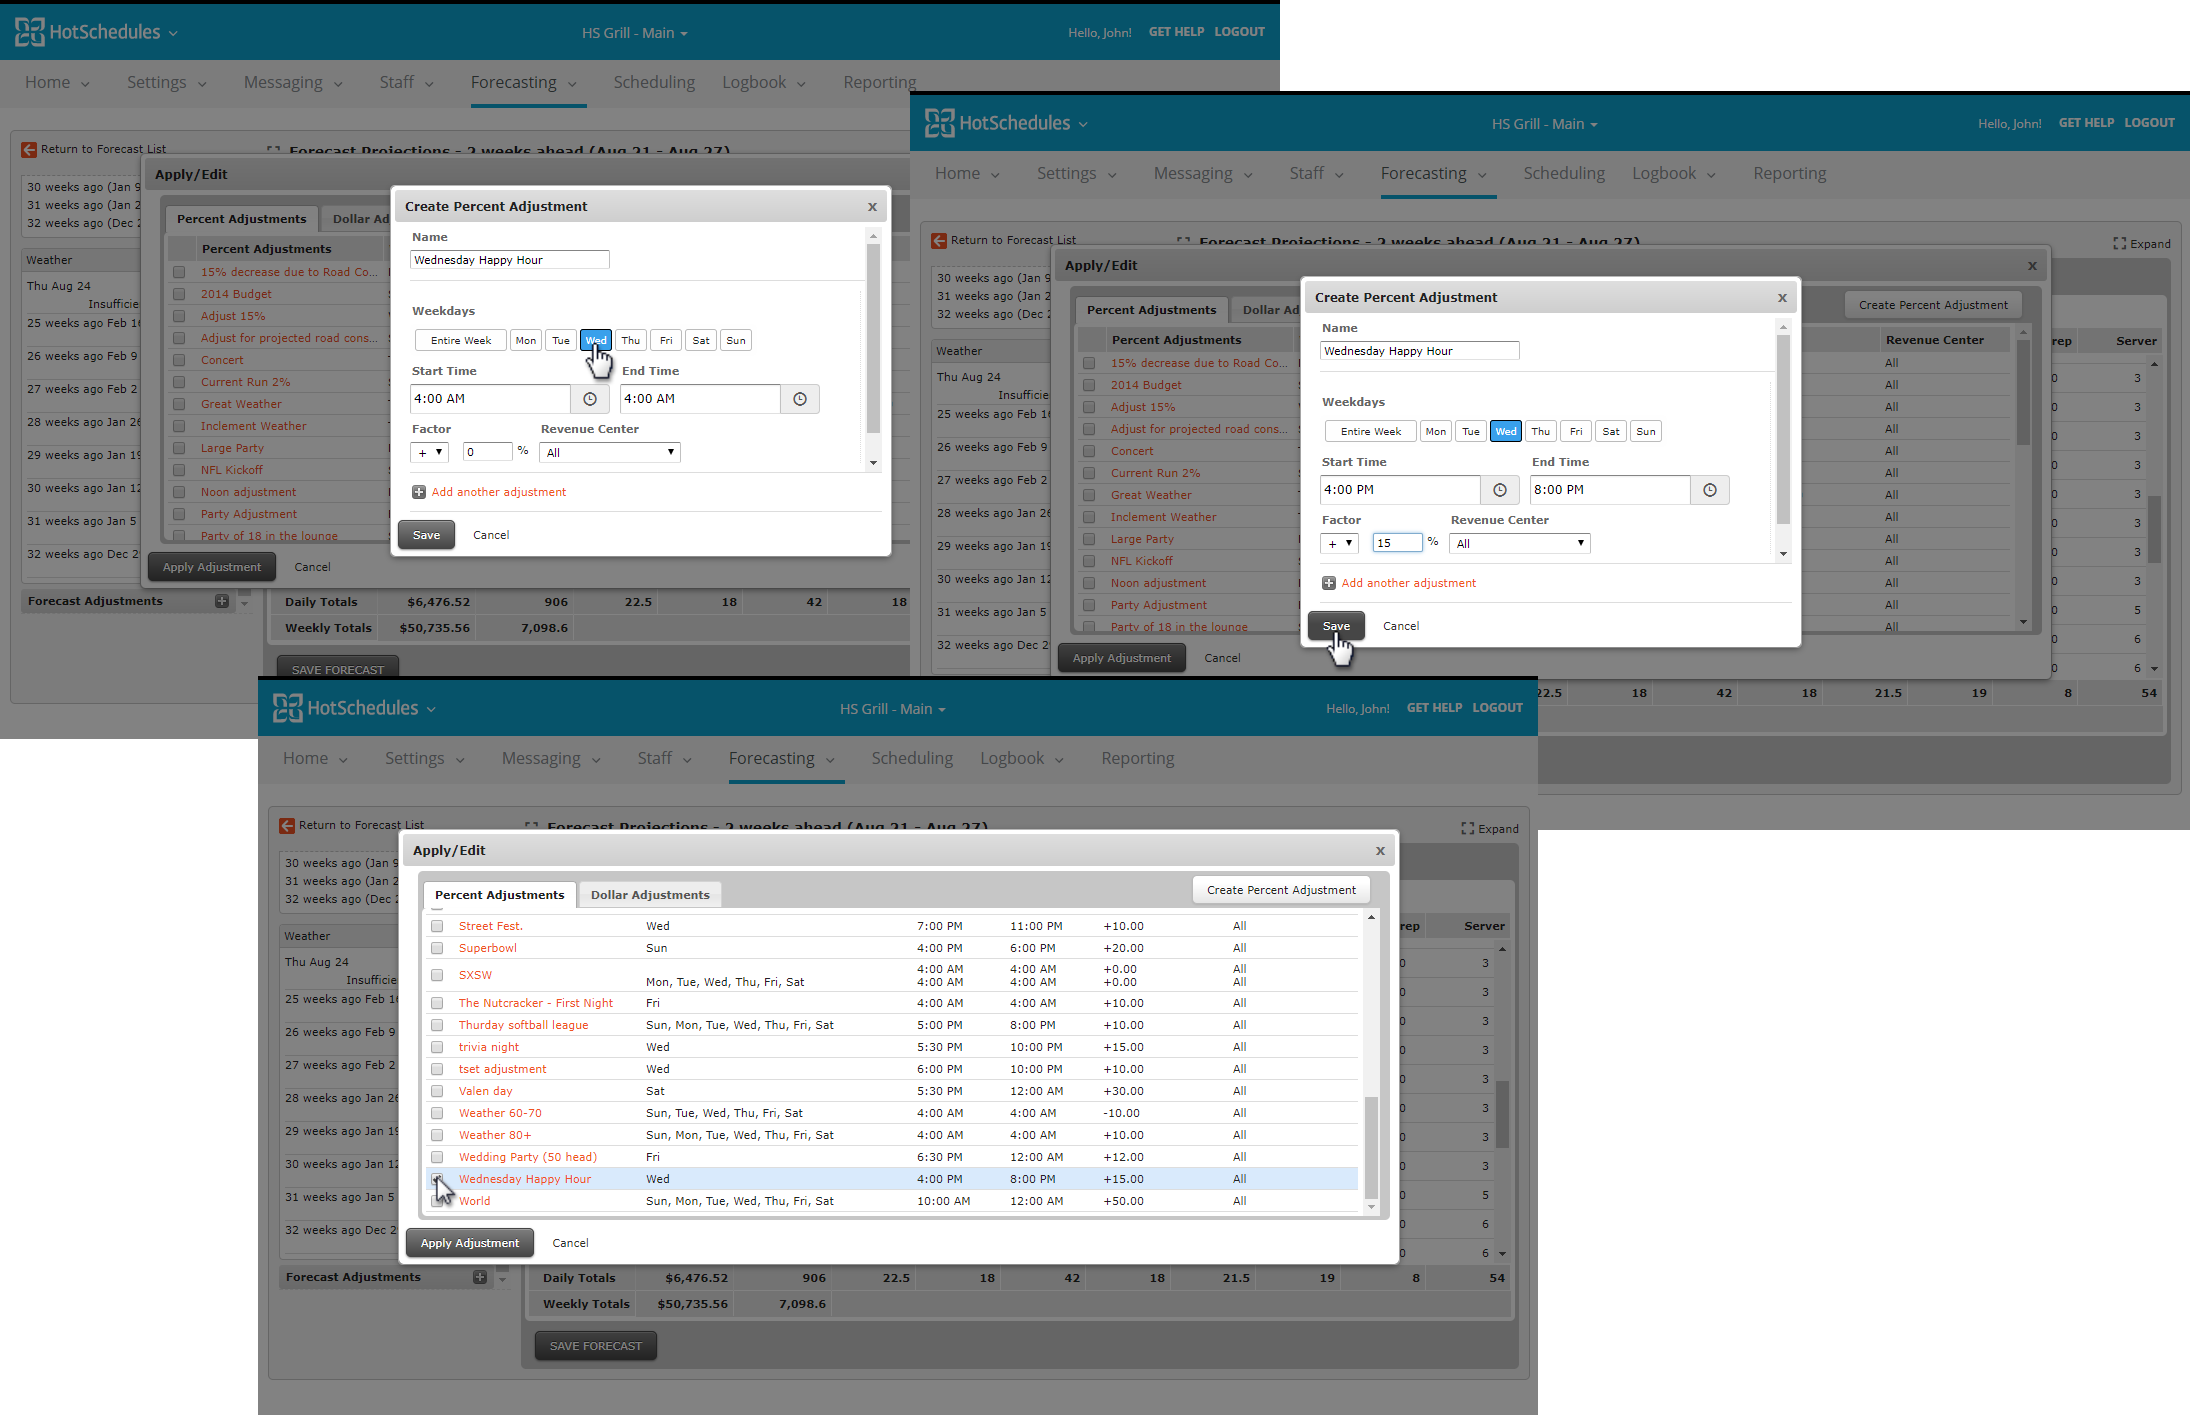
To add a new adjustment click Create Adjustment under the appropriate sub-tab.
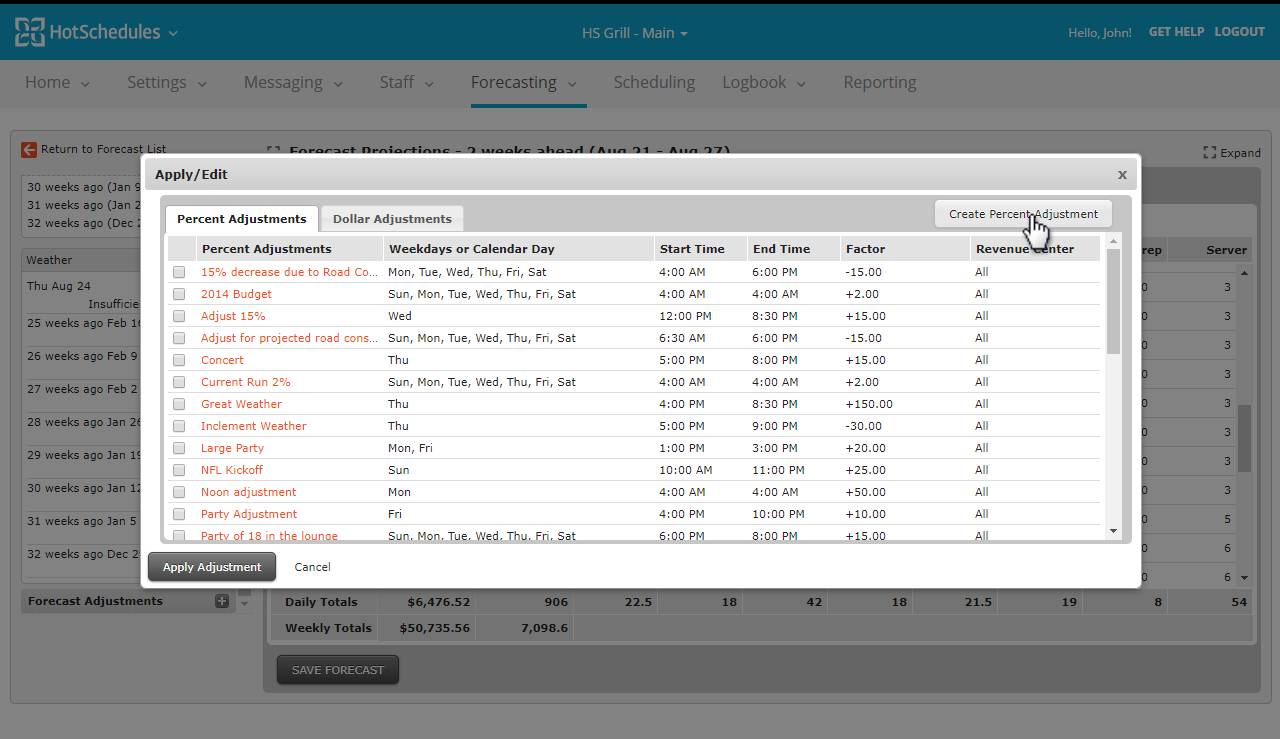
Give the adjustment a descriptive title. Then select the time frame, as well as the amount the adjustment may affect your sales. Save when finished.
To have the adjustment apply for a week, simply check its box, and apply the adjustment.
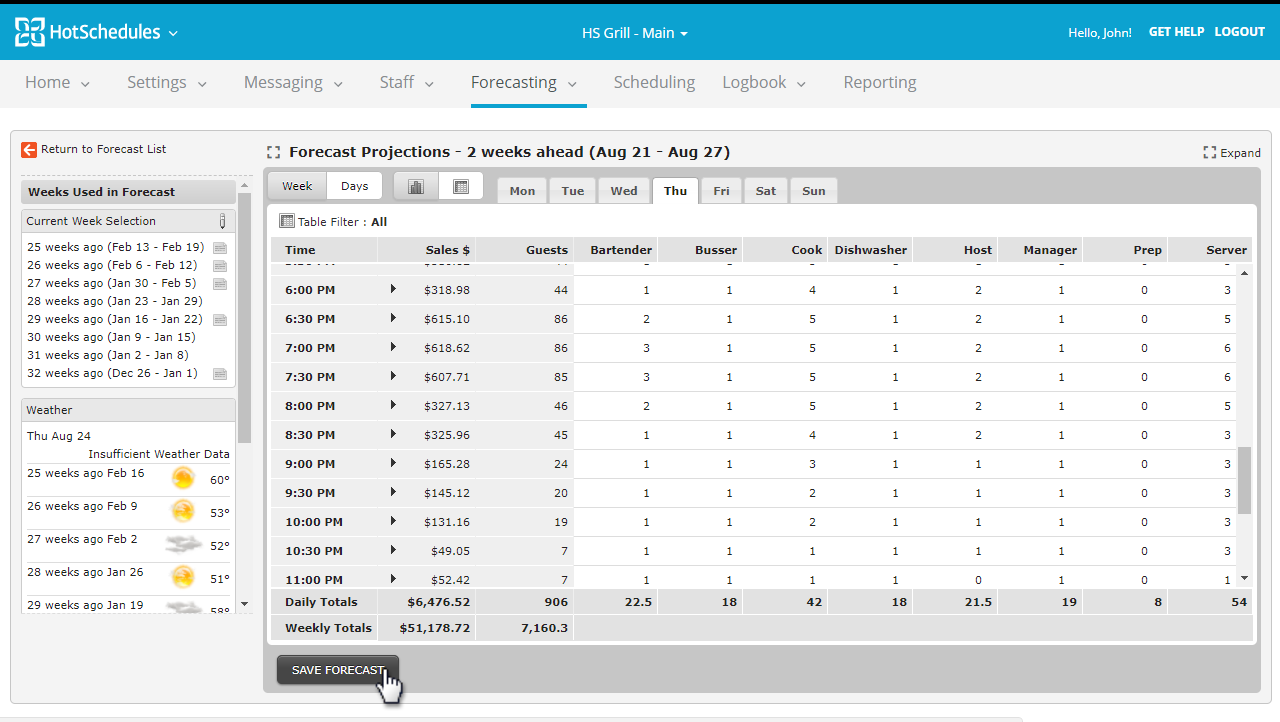
When finished, click Save Forecast. You can then use it to help create an efficient schedule.
Memos
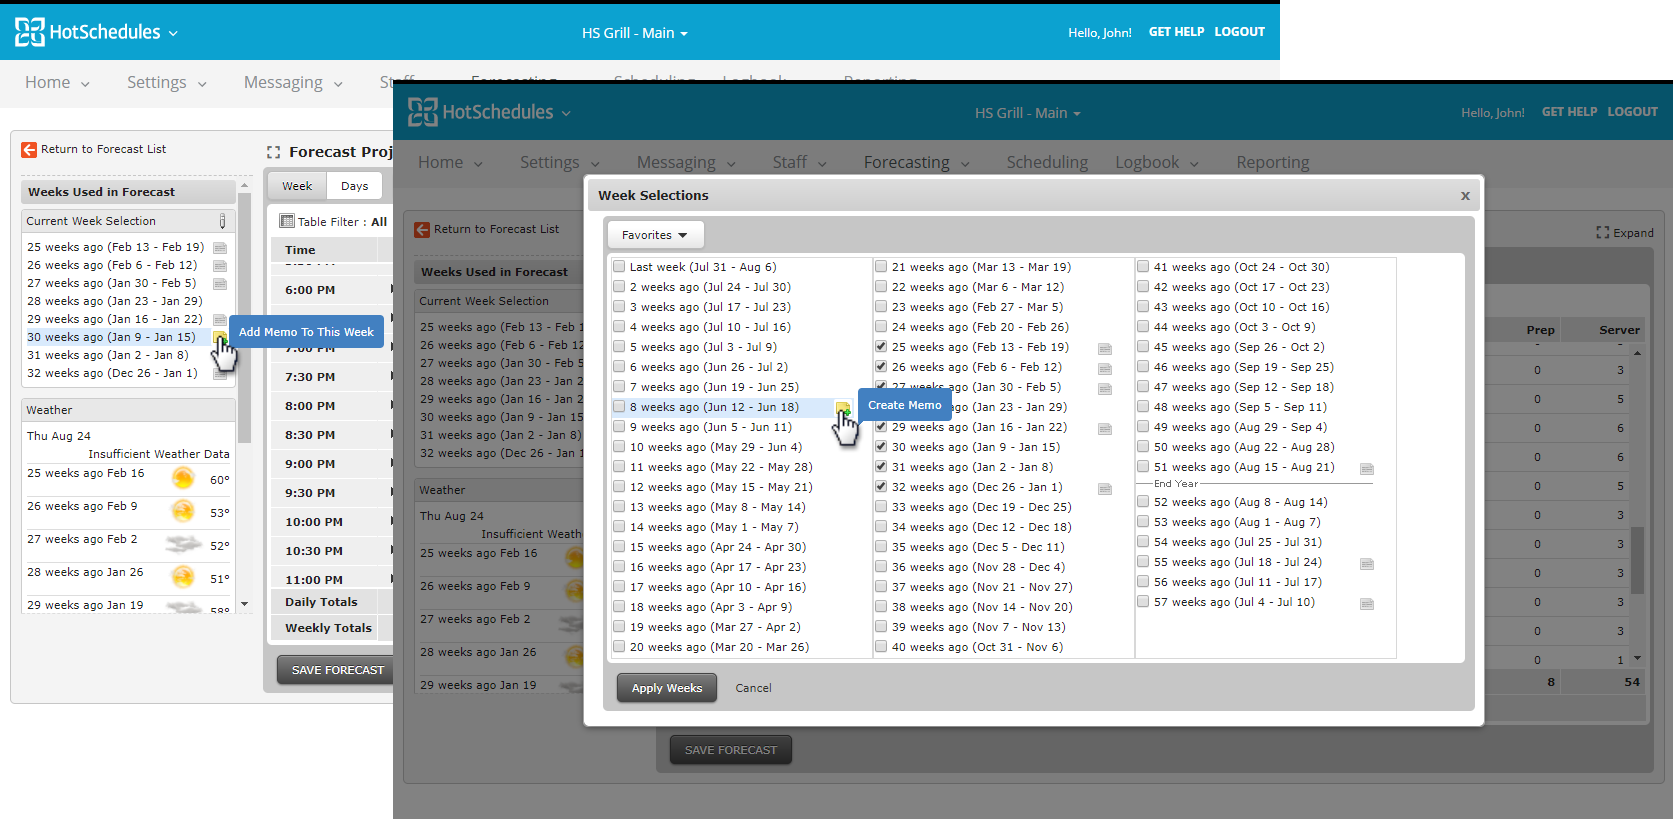
You may want to attach a note or memo to a specific week to remind you of unusual happenings in future forecasts. To add a memo, click the appropriate forecasted week.
You are able to add memos either in the Current Forecasted Weeks section, or in the Week Selections window of that week.
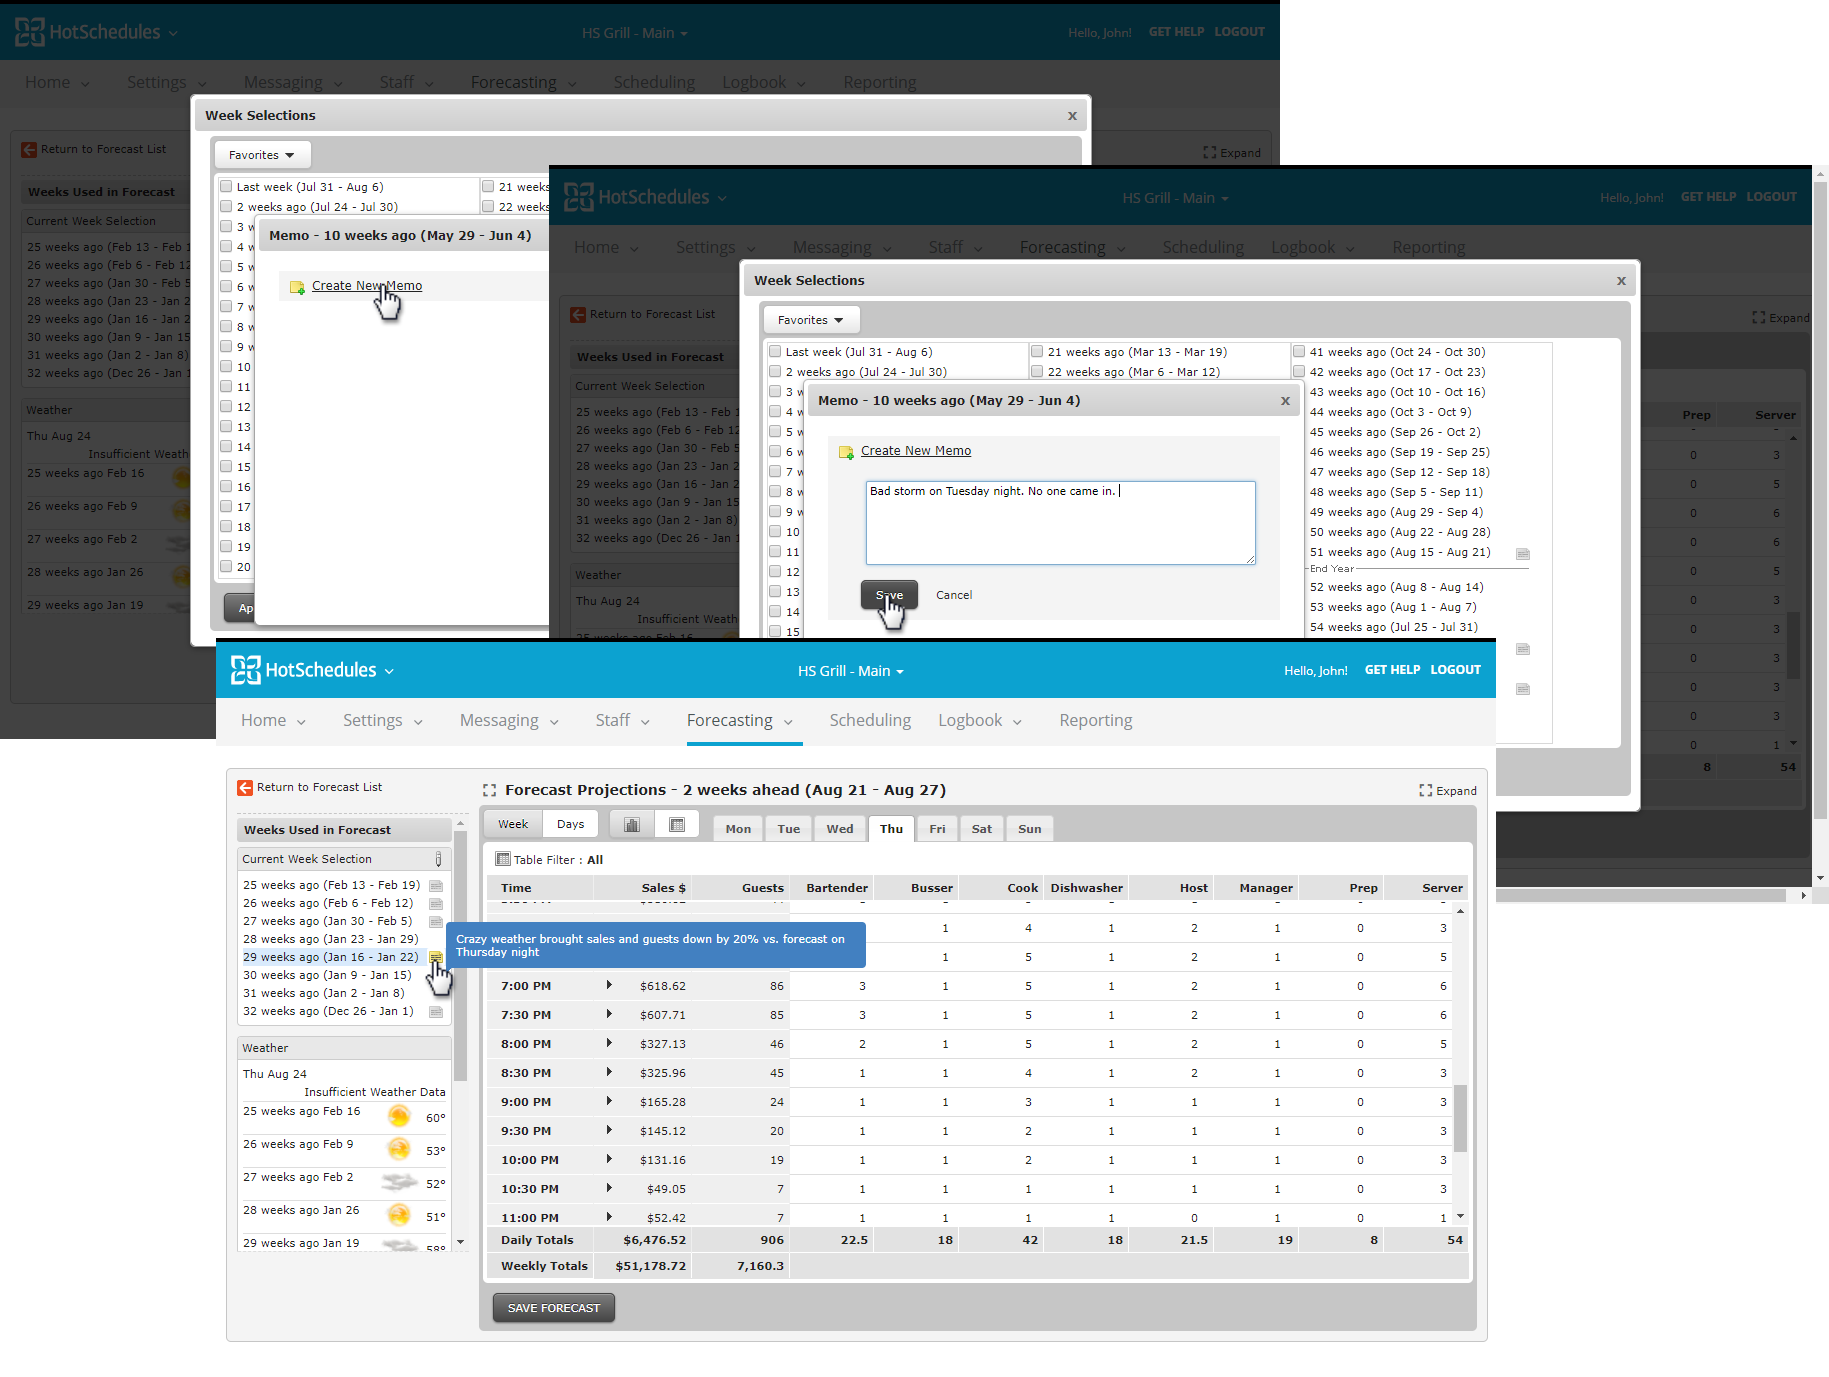
Click Create New Memo, type in your note and click Save. Read memos, then, by clicking their icon that appears.
Revenue Centers
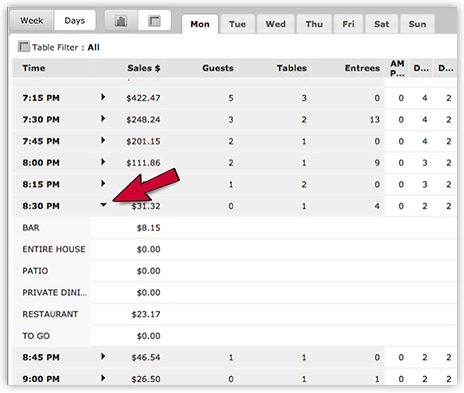
If you forecast for Revenue Centers, you can expand a time interval by clicking the corresponding arrow when viewing their daily projections. This allows you to view each RVC’s forecasted number for that particular interval of time.
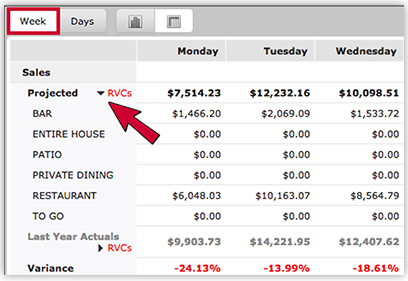
To view an entire week of projected RVC data, click the Week view and select the RVC arrow to expand.
Generating a Forecast - Template-Based
Generating a Forecast - Activity-Based

Comments
Please sign in to leave a comment.