What Is the Change?
The Menu Item Performance Matrix report has been enabled on all FnB Customer portals.
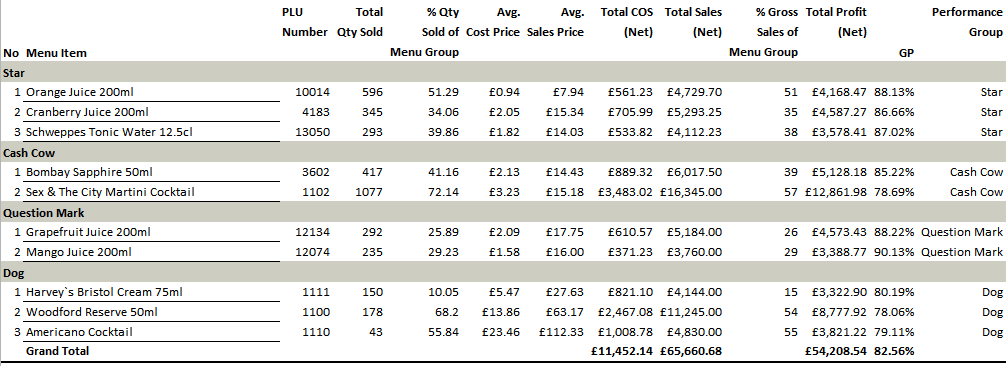
The report shows the performance of the top menu items in each of the four core sections of the Growth-share Matrix (Boston Matrix). The user will have options to select how many items are to be displayed in the output.
The report is located at site and enterprise manager level.
At site level all users have the option to run this report per site. In enterprise manager the user may only select the sites they have access to.
Reason for the Change
To provide customers with improved sales reporting.
Customers Affected
All FnB Manager Customers; Those who do not have Enterprise Manager will only get the site level report
Release Notes
Report Location
- Site Level: Reports Tab > Under the Menu Engineering section > “Menu Item Performance Matrix”
- Enterprise Manager: Home > Organisation > Reports Tab > “Menu Item Performance Matrix”
Report Criteria

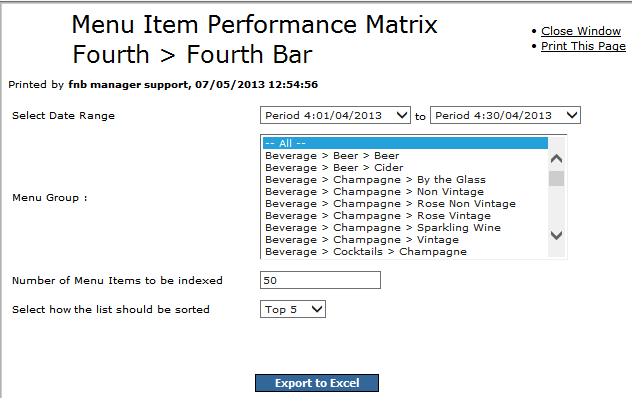
Fig 1 - Menu Item Performance Matrix Criteria
- ‘Number of Items to be Indexed’ – The top number of menu items, ranked by total sales, to include in the break down. The default is 50.
- 'Select how the list should be sorted’ – Whether to show the top 5, 10 or 25 items in each category.
Report Functionality
- The system takes the top number sales items (50 by default) entered in ‘Number of Items to be Indexed’ and ranks their performance based on GP% and then Net Sales Totals.
- It then sums the rank positions for each item basing them on the following criteria:
a) "Stars" GP is within top 25 GP% AND Sales are within top 25
b) "Cash Cows" is within top 25 sales AND above top 25 GP%
c) "Question Mark" is above top 25 sales AND within top 25 GP%
d) "Dogs" is above (not below?) top 25 sales AND above top 25 GP% therefore low on both.
- The report shows the top 5, 10 or 25 items (Selected in 'Select how the list should be sorted').
Sample Output

Fig 2 - Menu Item Performance Matrix Output

Comments
Please sign in to leave a comment.